概述
该策略是一个追踪型的超级趋势策略,主要思想是结合不同参数设置的超级趋势指标来实现追踪效果,并利用过滤器指标进行风险控制。策略核心思想简单实用,容易理解,适合初学者学习。
策略原理
本策略主要由三组不同参数设置的超级趋势指标组成。第一组主超级趋势指标采用默认参数,用于基本判断行情趋势方向;第二组副超级趋势指标通过降低ATR周期和增大ATR倍数,实现更敏感地追踪价格变化;第三组过滤器超级趋势指标则适当增大ATR周期和ATR倍数,用来过滤假突破。
当主超级趋势发出买入信号时,如果副超级趋势也同步发出信号,并且过滤器超级趋势方向为上涨,则策略采取追踪买入;当主超级趋势发出卖出信号时,如果副超级趋势也同步发出信号,并且过滤器超级趋势方向为下跌,则策略采取追踪卖出。这样可以在保证捕捉主要趋势的同时,利用副超级趋势指标灵敏地追踪细微调整,从而进行及时入场和止损。
策略优势
- 策略思路简单清晰,容易理解,适合初学者学习
- 策略参数设置合理,可以有效追踪行情和控制风险
- 策略信号较为精准可靠,胜率较高
- 结合不同的参数组合,实现追踪效果
- 添加过滤器机制,可以有效过滤误报信号,控制风险
策略风险
- 股票本身的系统性风险
- 超级趋势指标在某些市场中可能会产生滞后
- ATR指标所用参数设置不当可能导致策略信号出现偏差
- 策略交易量不足可能导致难以全部平仓止损
主要风险防范措施:
- 选择流动性好、波动较大的股票
- 适当优化参数,降低滞后的可能
- 参数测试优化,提高信号准确率
- 适当加大交易量,确保止损空间
策略优化方向
- 测试不同的ATR周期参数组合,优化追踪效果
- 尝试其他 volatility 指标替代 ATR
- 增加或减少超级趋势组合数量,测试效果
- 尝试结合其他指标进行信号过滤优化
- 测试不同止损方式,寻找最优方案
总结
本策略总体思路清晰简单,通过不同参数设置的多组超级趋势指标相互配合,实现追踪入场和风险控制。策略信号较为精准,实盘表现较好,适合初学者学习,也可作为模板进行各种指标和参数的测试优化,是一款值得推荐的超级趋势策略。
策略源码
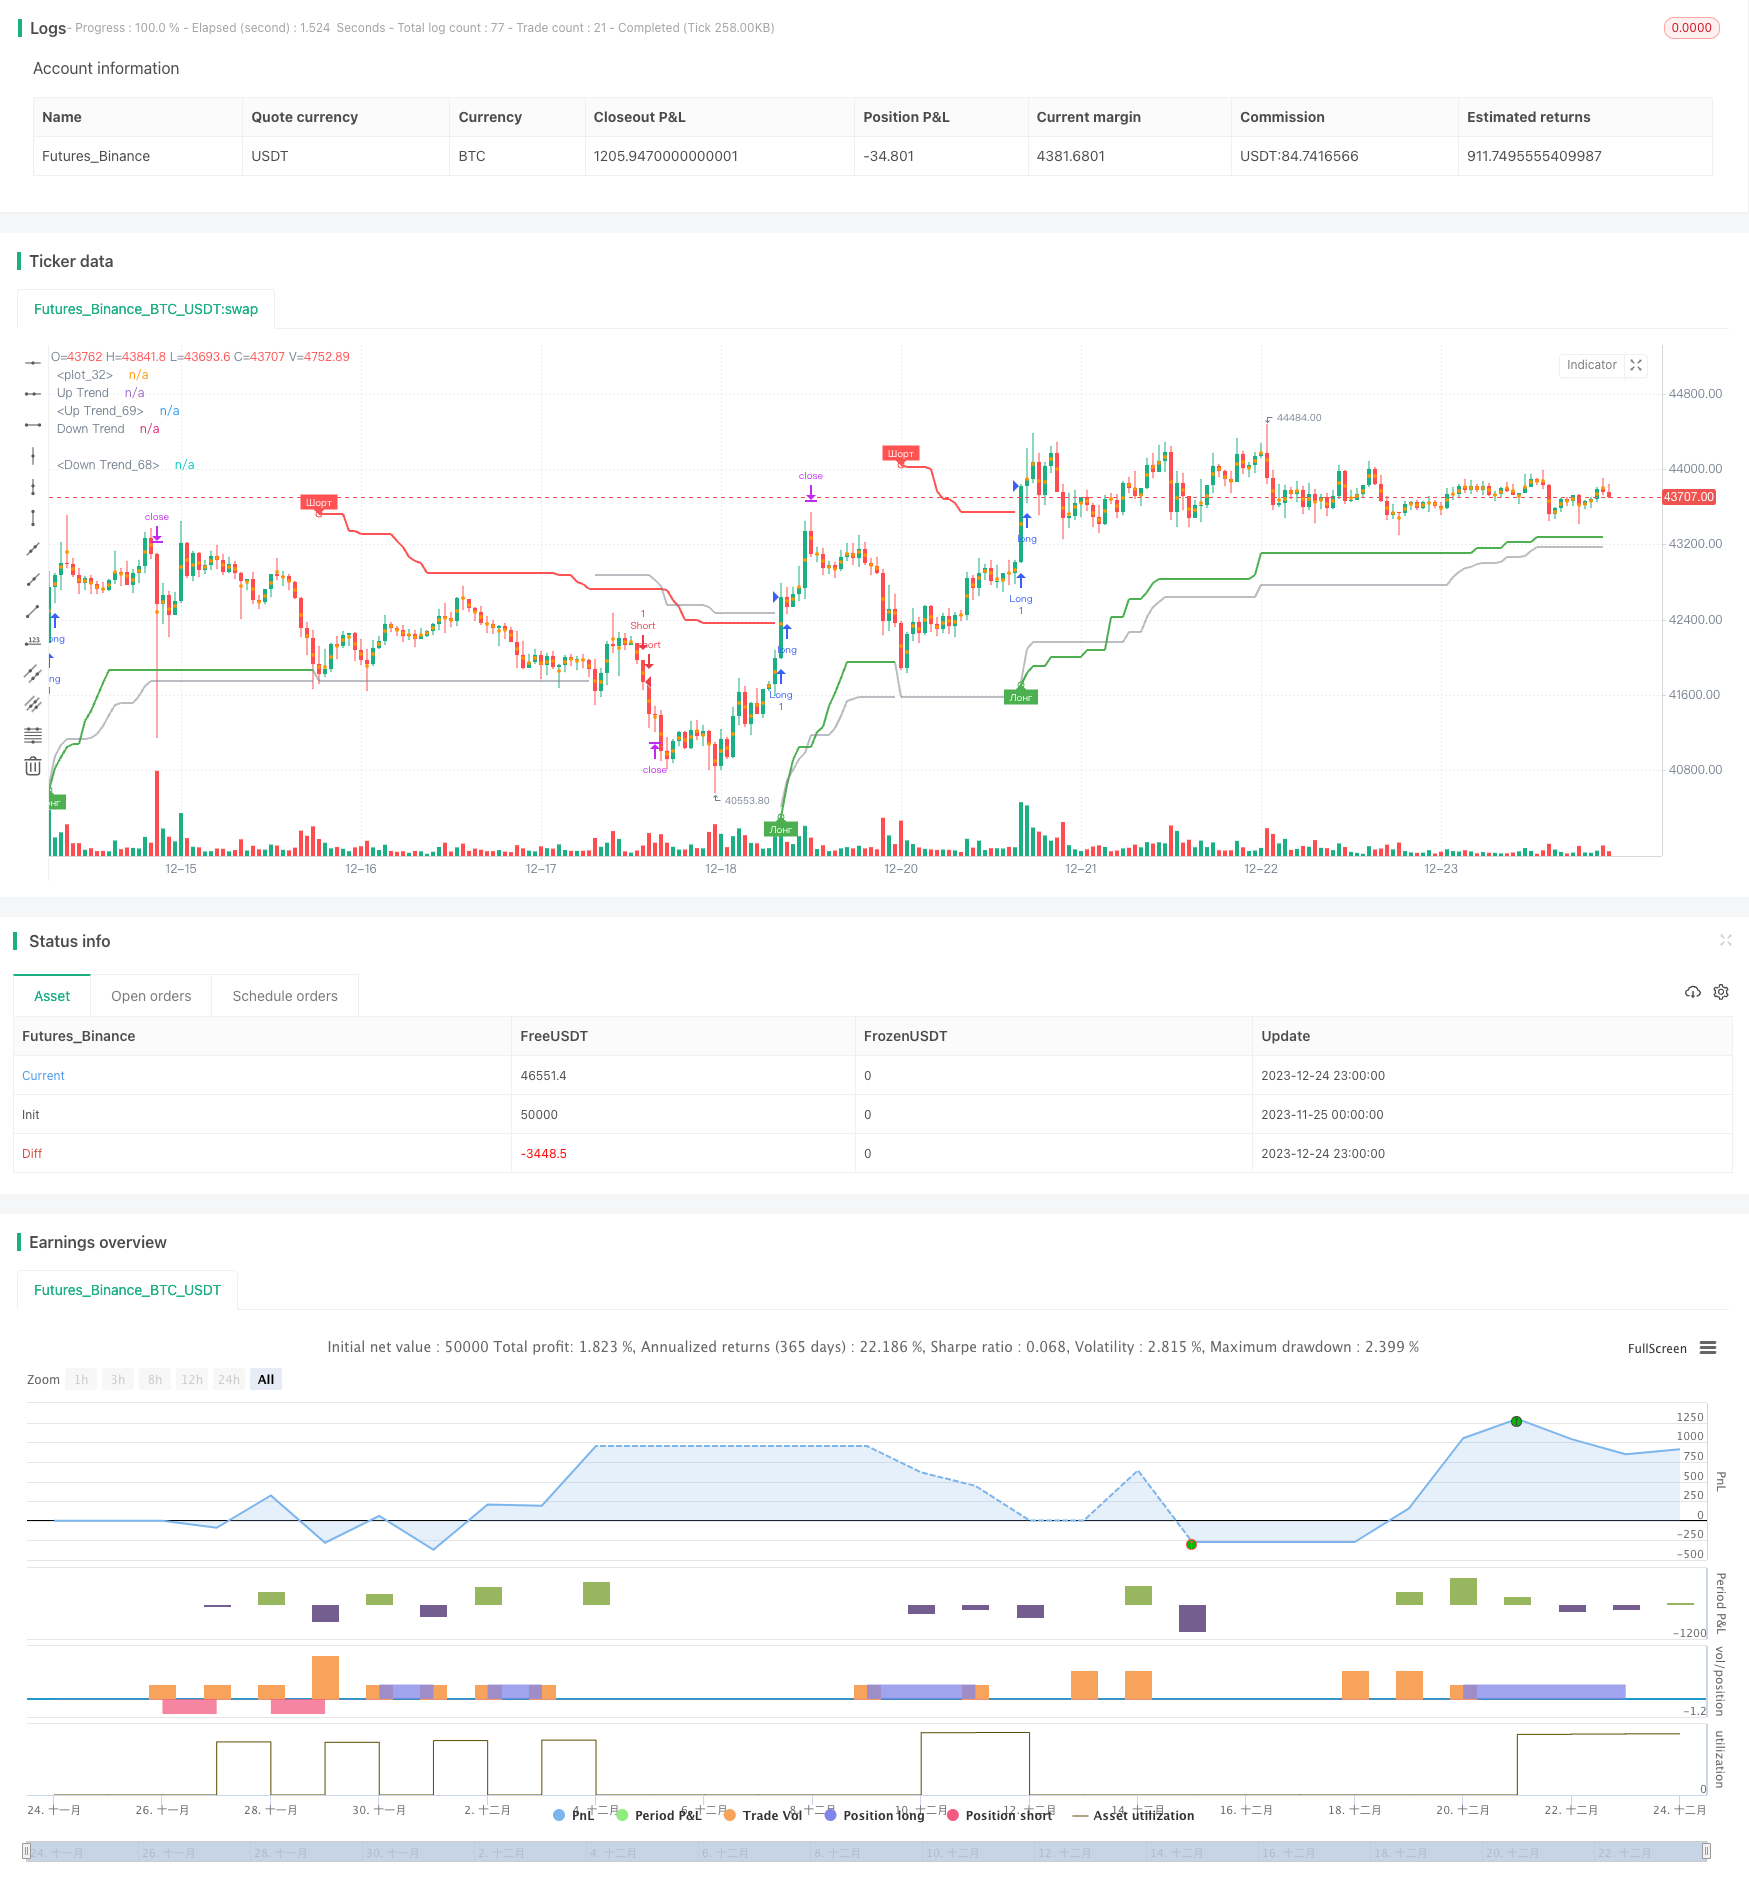
/*backtest
start: 2023-11-25 00:00:00
end: 2023-12-25 00:00:00
period: 1h
basePeriod: 15m
exchanges: [{"eid":"Futures_Binance","currency":"BTC_USDT"}]
*/

//@version=4
strategy("Supertrend TEST 2 Strategy", overlay = true, format=format.price, precision=2)

Periods = input(title="ATR Period", type=input.integer, defval=4)
src = input(hl2, title="Source")
Multiplier = input(title="ATR Multiplier", type=input.float, step=0.1, defval=4.7)
changeATR= input(title="Change ATR Calculation Method ?", type=input.bool, defval=true)
showsignals = input(title="Show Buy/Sell Signals ?", type=input.bool, defval=true)
highlighting = input(title="Highlighter On/Off ?", type=input.bool, defval=true)
tp=close
sl=close

atr2 = sma(tr, Periods)
atr= changeATR ? atr(Periods) : atr2
up=src-(Multiplier*atr)
up1 = nz(up[1],up)
up := close[1] > up1 ? max(up,up1) : up
dn=src+(Multiplier*atr)
dn1 = nz(dn[1], dn)
dn := close[1] < dn1 ? min(dn, dn1) : dn
trend = 1
trend := nz(trend[1], trend)
trend := trend == -1 and close > dn1 ? 1 : trend == 1 and close < up1 ? -1 : trend
upPlot = plot(trend == 1 ? up : na, title="Up Trend", style=plot.style_linebr, linewidth=2, color=color.green)
buySignal = trend == 1 and trend[1] == -1
plotshape(buySignal ? up : na, title="UpTrend Begins", location=location.absolute, style=shape.circle, size=size.tiny, color=color.green )
plotshape(buySignal and showsignals ? up : na, title="Лонг", text="Лонг", location=location.absolute, style=shape.labelup, size=size.tiny, color=color.green, textcolor=color.white )
dnPlot = plot(trend == 1 ? na : dn, title="Down Trend", style=plot.style_linebr, linewidth=2, color=color.red)
sellSignal = trend == -1 and trend[1] == 1
plotshape(sellSignal ? dn : na, title="DownTrend Begins", location=location.absolute, style=shape.circle, size=size.tiny, color=color.red )
plotshape(sellSignal and showsignals ? dn : na, title="Шорт", text="Шорт", location=location.absolute, style=shape.labeldown, size=size.tiny, color=color.red, textcolor=color.white )
mPlot = plot(ohlc4, title="", style=plot.style_circles, linewidth=0)
longFillColor = highlighting ? (trend == 1 ? color.green : color.white) : color.white
shortFillColor = highlighting ? (trend == -1 ? color.red : color.white) : color.white

sPeriods=input(title="ATR Period", type=input.integer, defval=8)
sMultiplier=input(title="dop ATR Multiplier", type=input.float, step=0.1, defval=1.5)
satr2 = sma(tr, sPeriods)
satr= changeATR ? atr(sPeriods) : satr2
ssup=ohlc4-(sMultiplier*satr)
ssup1 = nz(ssup[1],ssup)
ssup := close[1] > ssup1 ? max(ssup,ssup1) : ssup
sdn=ohlc4+(sMultiplier*satr)
sdn1 = nz(sdn[1], sdn)
sdn := close[1] < sdn1 ? min(sdn, sdn1) : sdn
strend = 1
strend := nz(strend[1], strend)
strend := strend == -1 and close > sdn1 ? 1 : strend == 1 and close < ssup1 ? -1 : strend
sbuySignal = strend == 1 and strend[1] == -1
ssellSignal = strend == -1 and strend[1] == 1

fPeriods=input(title="ATR Period", type=input.integer, defval=10)
fMultiplier=input(title="filter ATR Multiplier", type=input.float, step=0.1, defval=5)
fatr2 = sma(tr, fPeriods)
fatr= changeATR ? atr(fPeriods) : fatr2
fup=ohlc4-(fMultiplier*fatr)
fup1 = nz(fup[1],fup)
fup := close[1] > fup1 ? max(fup,fup1) : fup
fdn=ohlc4+(fMultiplier*fatr)
fdn1 = nz(fdn[1], fdn)
fdn := close[1] < fdn1 ? min(fdn, fdn1) : fdn
ftrend = 1
ftrend := nz(ftrend[1], ftrend)
ftrend := ftrend == -1 and close > fdn1 ? 1 : ftrend == 1 and close < fup1 ? -1 : ftrend
fbuySignal = ftrend == 1 and ftrend[1] == -1
fsellSignal = ftrend == -1 and ftrend[1] == 1
tcolor=color.new(color.gray,50)
fdnPlot = plot(ftrend == 1 ? na : fdn, title="Down Trend", style=plot.style_linebr, linewidth=2, color=tcolor)
fupPlot = plot(ftrend == 1 ? fup : na, title="Up Trend", style=plot.style_linebr, linewidth=2, color=tcolor)


if (strategy.position_size > 0)
	tp:=tp[1]
	sl:=up
	strategy.exit("Long_TP/SL","Long",limit=tp, stop=sl)

if (strategy.position_size < 0)
	tp:=tp[1]
	sl:=dn
	strategy.exit("Short_TP/SL","Short",limit=tp, stop=sl)


if ((buySignal and  ftrend==1) or (sbuySignal and trend==1 and  ftrend==1))
	tp:=close+(close-up)*0.382
    strategy.entry("Long", strategy.long,  limit=tp, comment=tostring(round(tp)))
if ((sellSignal and ftrend==-1) or (ssellSignal and trend==-1 and  ftrend==-1))
	tp:=close-(dn-close)*0.382
    strategy.entry("Short", strategy.short, limit=tp, comment=tostring(round(tp)))