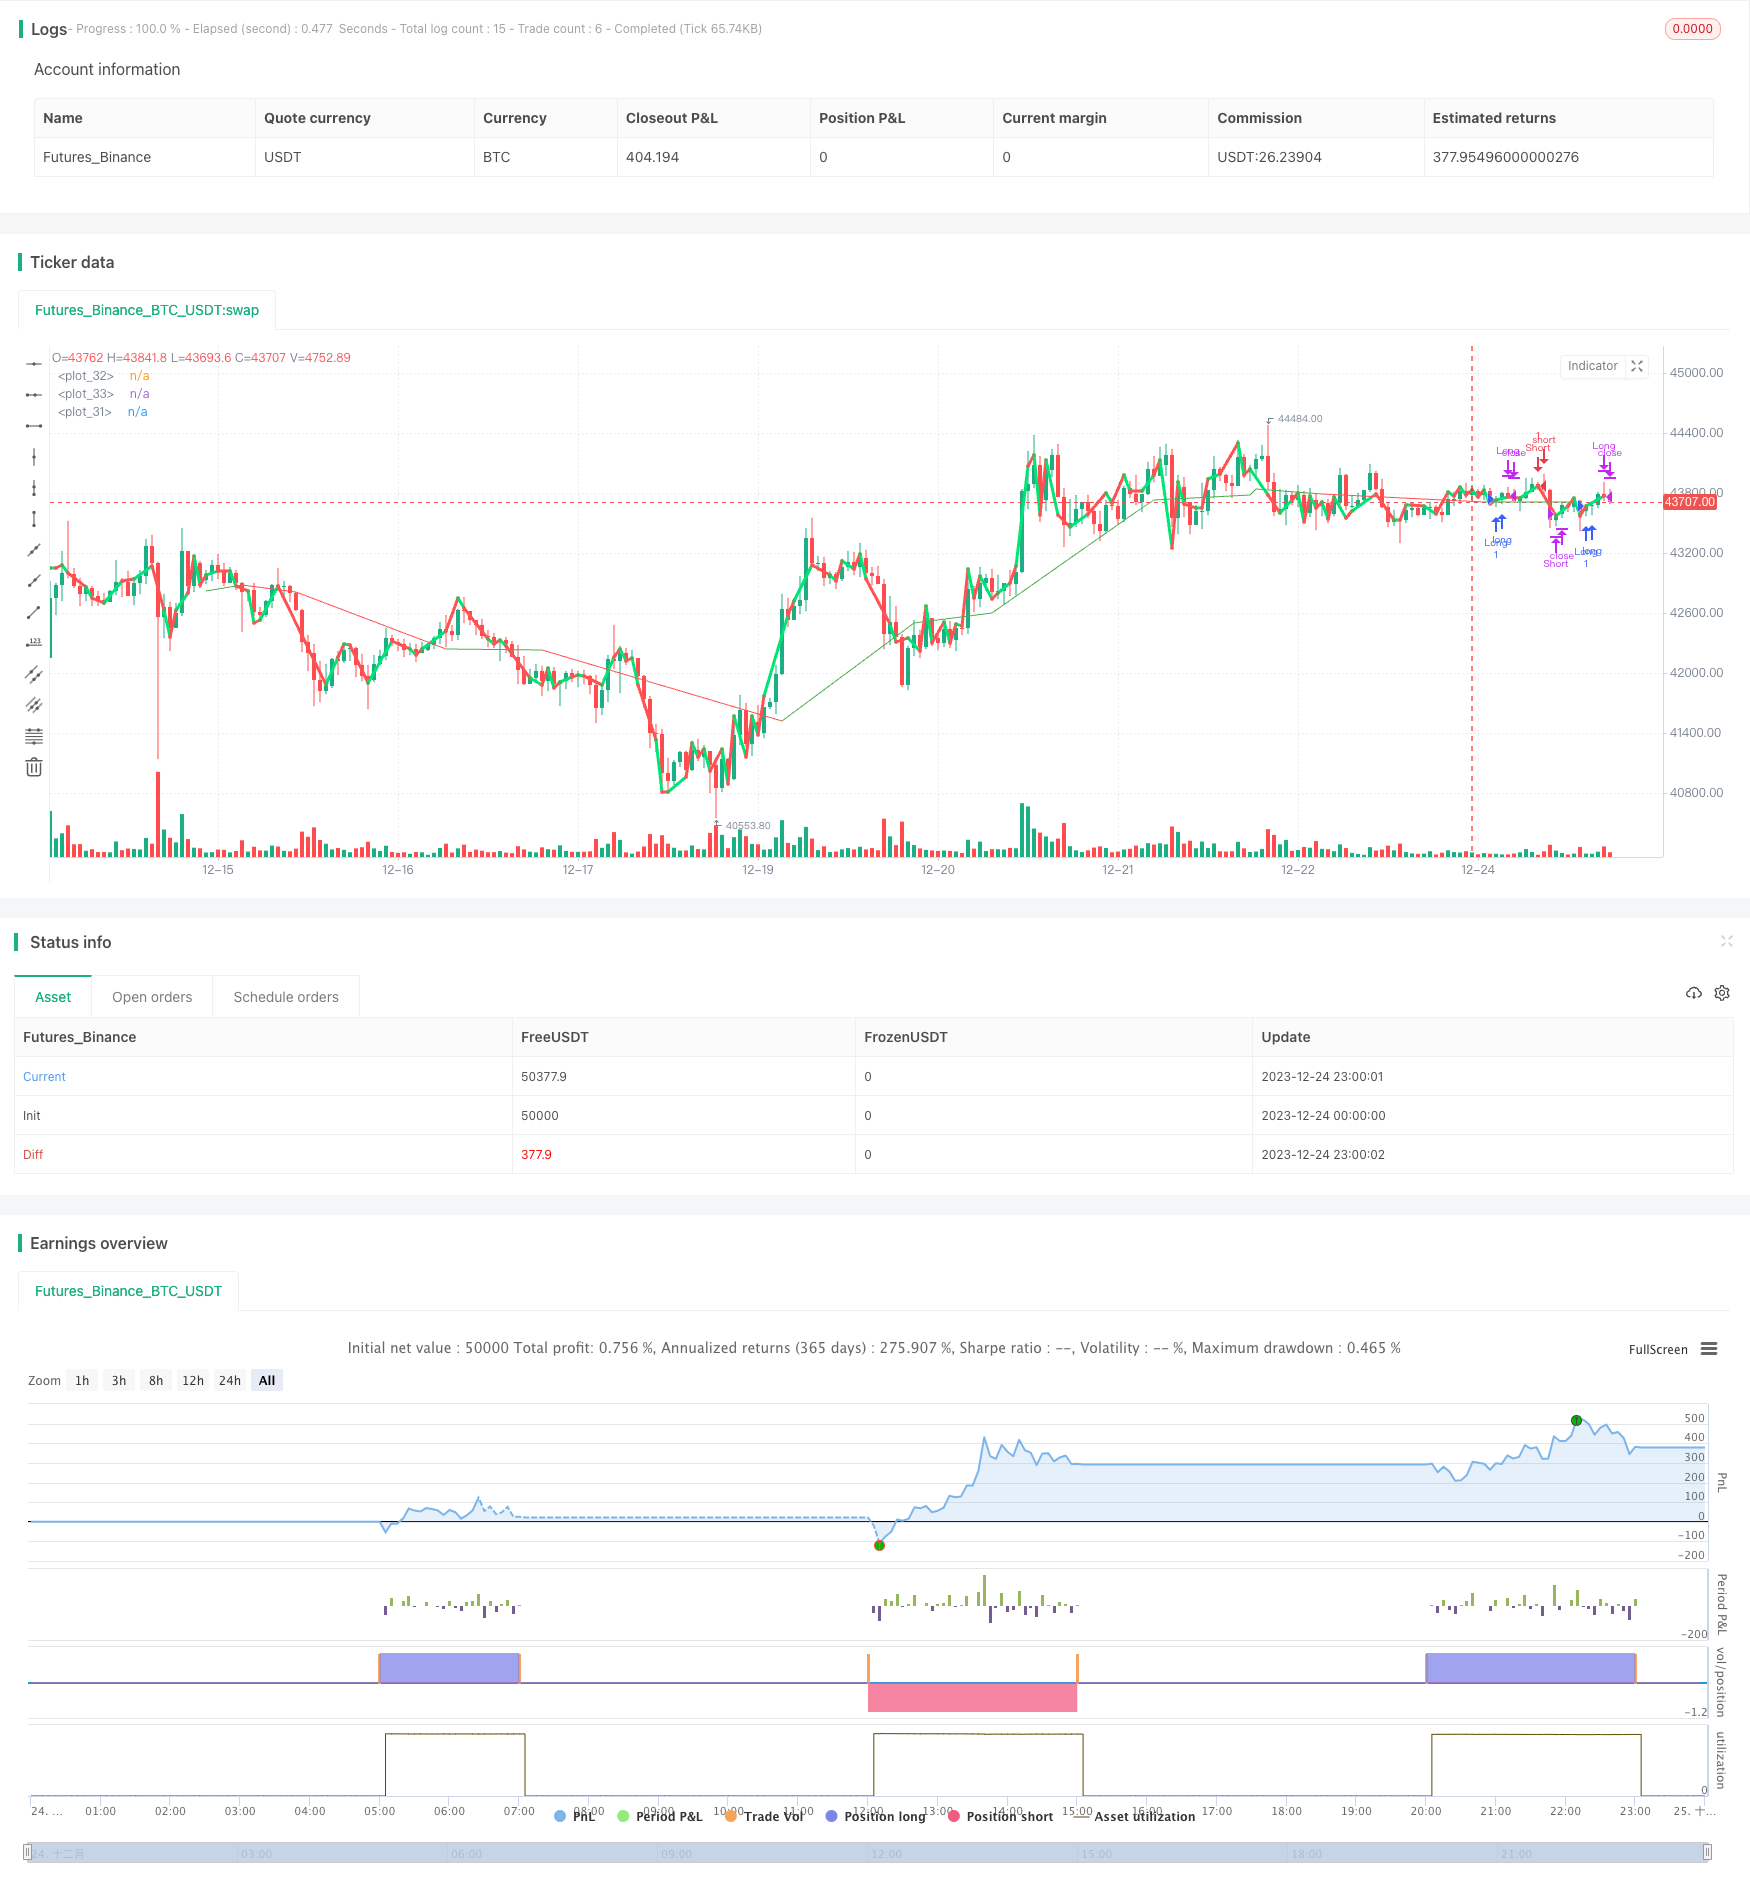
概述
双均线黄金交叉量化策略(Dual Moving Average Golden Cross Quantitative Strategy)是一种技术指标量化交易策略。它通过计算两条不同周期的均线,判断行情趋势,实现低风险交易。当短周期均线上穿较长周期均线时,产生黄金交叉信号,做多;当短周期均线下穿较长周期均线时,产生死亡交叉信号,做空。该策略同时结合价格通道指标,避免假突破。
策略原理
双均线黄金交叉量化策略基于均线理论。均线能够有效地滤波市场噪音,指示长期趋势方向。当短周期均线上穿较长周期均线时,表示行情由下向上反转,属于买入信号;当短均线下穿长均线时,表示行情由上向下反转,属于卖出信号。该策略设置两组均线,第一组是2日均线和3日均线,第二组是420日均线。当2日均线上穿3日均线时产生买入信号,下穿时产生卖出信号。420日均线用来判断长期趋势,避免交易前短期回调。
该策略的核心代码逻辑是:
- 计算2日均线、3日均线和420日均线
- 判断2日均线和3日均线的金叉死叉情况
- 使用420日均线过滤信号,避免假突破
- 产生买入和卖出信号
具体原理是:
- 计算最后3日内的收盘价2日简单移动平均线n2ma和3日简单移动平均线nma
- 计算最后420日内的收盘价的加权移动平均线rvwma
- 当n2ma上穿nma时产生买入信号
- 当n2ma下穿nma时产生卖出信号
- 使用rvwma过滤信号,只有n2ma在rvwma之下才产生买入信号,n2ma在rvwma之上才产生卖出信号
通过双均线交叉判断短期趋势反转点,设置参数过滤器避免误交易。该策略可以有效捕捉短期调整后的趋势反转机会,profit因子较高。
优势分析
双均线黄金交叉量化策略具有以下优势:
- 简单可靠:使用双均线交叉理论,判断短期价格变化趋势,信号产生简单清晰。
- 灵敏度高:2日和3日均线参数设置比较灵敏,能快速捕捉短期价格变化。
- Noise过滤:引入价格通道指标,有效过滤噪音,避免误交易。
- 适应性强:双均线交叉理论适用于不同品种和不同周期,容易实施。
- 易于优化:改变均线参数组合,调整过滤器参数,策略优化空间大。
- 实盘验证:该类双均线交叉策略已经在实盘中验证,效果较稳定。
风险分析
双均线黄金交叉量化策略也存在以下风险:
- 回调风险:价格短期反弹回调可能触发止损。
- 趋势反转风险:突发事件导致市场长期趋势反转亏损。
- 参数优化风险:参数不当可能导致策略效果变差。
- 过优化风险:参数优化过度可能导致过拟合。
- 实盘偏差风险:实盘与回测存在偏差可能影响效果。
可以通过以下方式降低风险:
- 设置合理止损位,控制单笔亏损。
- 结合基本面分析,避免逆市交易。
- 选择适合品种和合适周期优化。
- 做好参数敏感性测试。
- 增加实盘验证环节。
优化方向
双均线黄金交叉量化策略还可以从以下方面进行优化:
参数优化:调整均线参数以及通道指标参数,选择最优参数组合。可以使用遗传算法等工具辅助优化。
品种择时:根据不同品种的特性,选取最匹配的均线参数。例如兴趣相关品种设置更短周期均线。
止损策略优化:设定 float 动态止损、追踪止损等止损方式,避免回调止损。
同向操作优化:结合趋势指标,采取趋势同向操作,避免逆势交易。
机器学习结合:使用 LSTM、RNN 等深度学习模型辅助判断信号质量和确定入场时机。
总结
双均线黄金交叉量化策略通过简单的均线交叉原理判断价格短期趋势。设置通道指标有效过滤误信号。策略逻辑简单易于实现,参数调整灵活,实盘验证效果较好,是一个值得推荐的量化策略。该策略可以通过参数优化、止损优化、机器学习等手段进行升级,效果会更好,适合用于数字货币、股票等品种的算法交易。
/*backtest
start: 2023-12-24 00:00:00
end: 2023-12-25 00:00:00
period: 1h
basePeriod: 15m
exchanges: [{"eid":"Futures_Binance","currency":"BTC_USDT"}]
*/

//@version=4
//                                                Indicator420 by SeaSide420
strategy("Indicator420 strategy", overlay=true)
q=input(title="HullMA",defval=420)
z=input(title="HullMA cross",defval=3)
a=input(title="VWMA",defval=14)
rvwma=vwma(close,round(a))
rvwma2=vwma(close,round(a*2))
rvwma3=vwma(close,round(a*3))
n2ma=2*wma(close,round(z/2))
nma=wma(close,z)
diff=n2ma-nma
sqn=round(sqrt(z))
n2ma1=2*wma(close[1],round(z/2))
nma1=wma(close[1],z)
diff1=n2ma1-nma1
sqn1=round(sqrt(z))
n2ma2=2*wma(close[2],round(q/2))
nma2=wma(close[2],q)
diff2=n2ma2-nma2
sqn2=round(sqrt(q))
n1=wma(diff,sqn)
n2=wma(diff1,sqn)
n3=wma(diff2,sqn)
b=n1>n2?red:lime
c=n1>n2?green:red
d=n3>rvwma3?red:green
e=rvwma2>rvwma3?green:red
f=n1>n2?red:green
//plot(rvwma3, color=e, linewidth=1)
plot(cross(rvwma, rvwma2) ? rvwma : na, style = line,color=e, linewidth = 1)
plot(cross(n1, n2) ? n1 : na, style = line,color=b, linewidth = 3)
plot(cross(n1, n2) ? n1 : na, style = circles,color=c, linewidth = 4)
closelong = n1<n2
if (closelong)
    strategy.close("Long")
closeshort = n1>n2
if (closeshort)
    strategy.close("Short")
longCondition = n1>n2 and strategy.opentrades<1 and n1<rvwma3
if (longCondition)
    strategy.entry("Long",strategy.long)
shortCondition = n1<n2 and strategy.opentrades<1 and n1>rvwma3
if (shortCondition)
    strategy.entry("Short",strategy.short)