概述
双向RSI突破策略是一个利用RSI指标识别价格反转点的算法交易策略。它通过比较RSI指标与设定的上下阈值,判断行情是否超买超卖并发出交易信号。
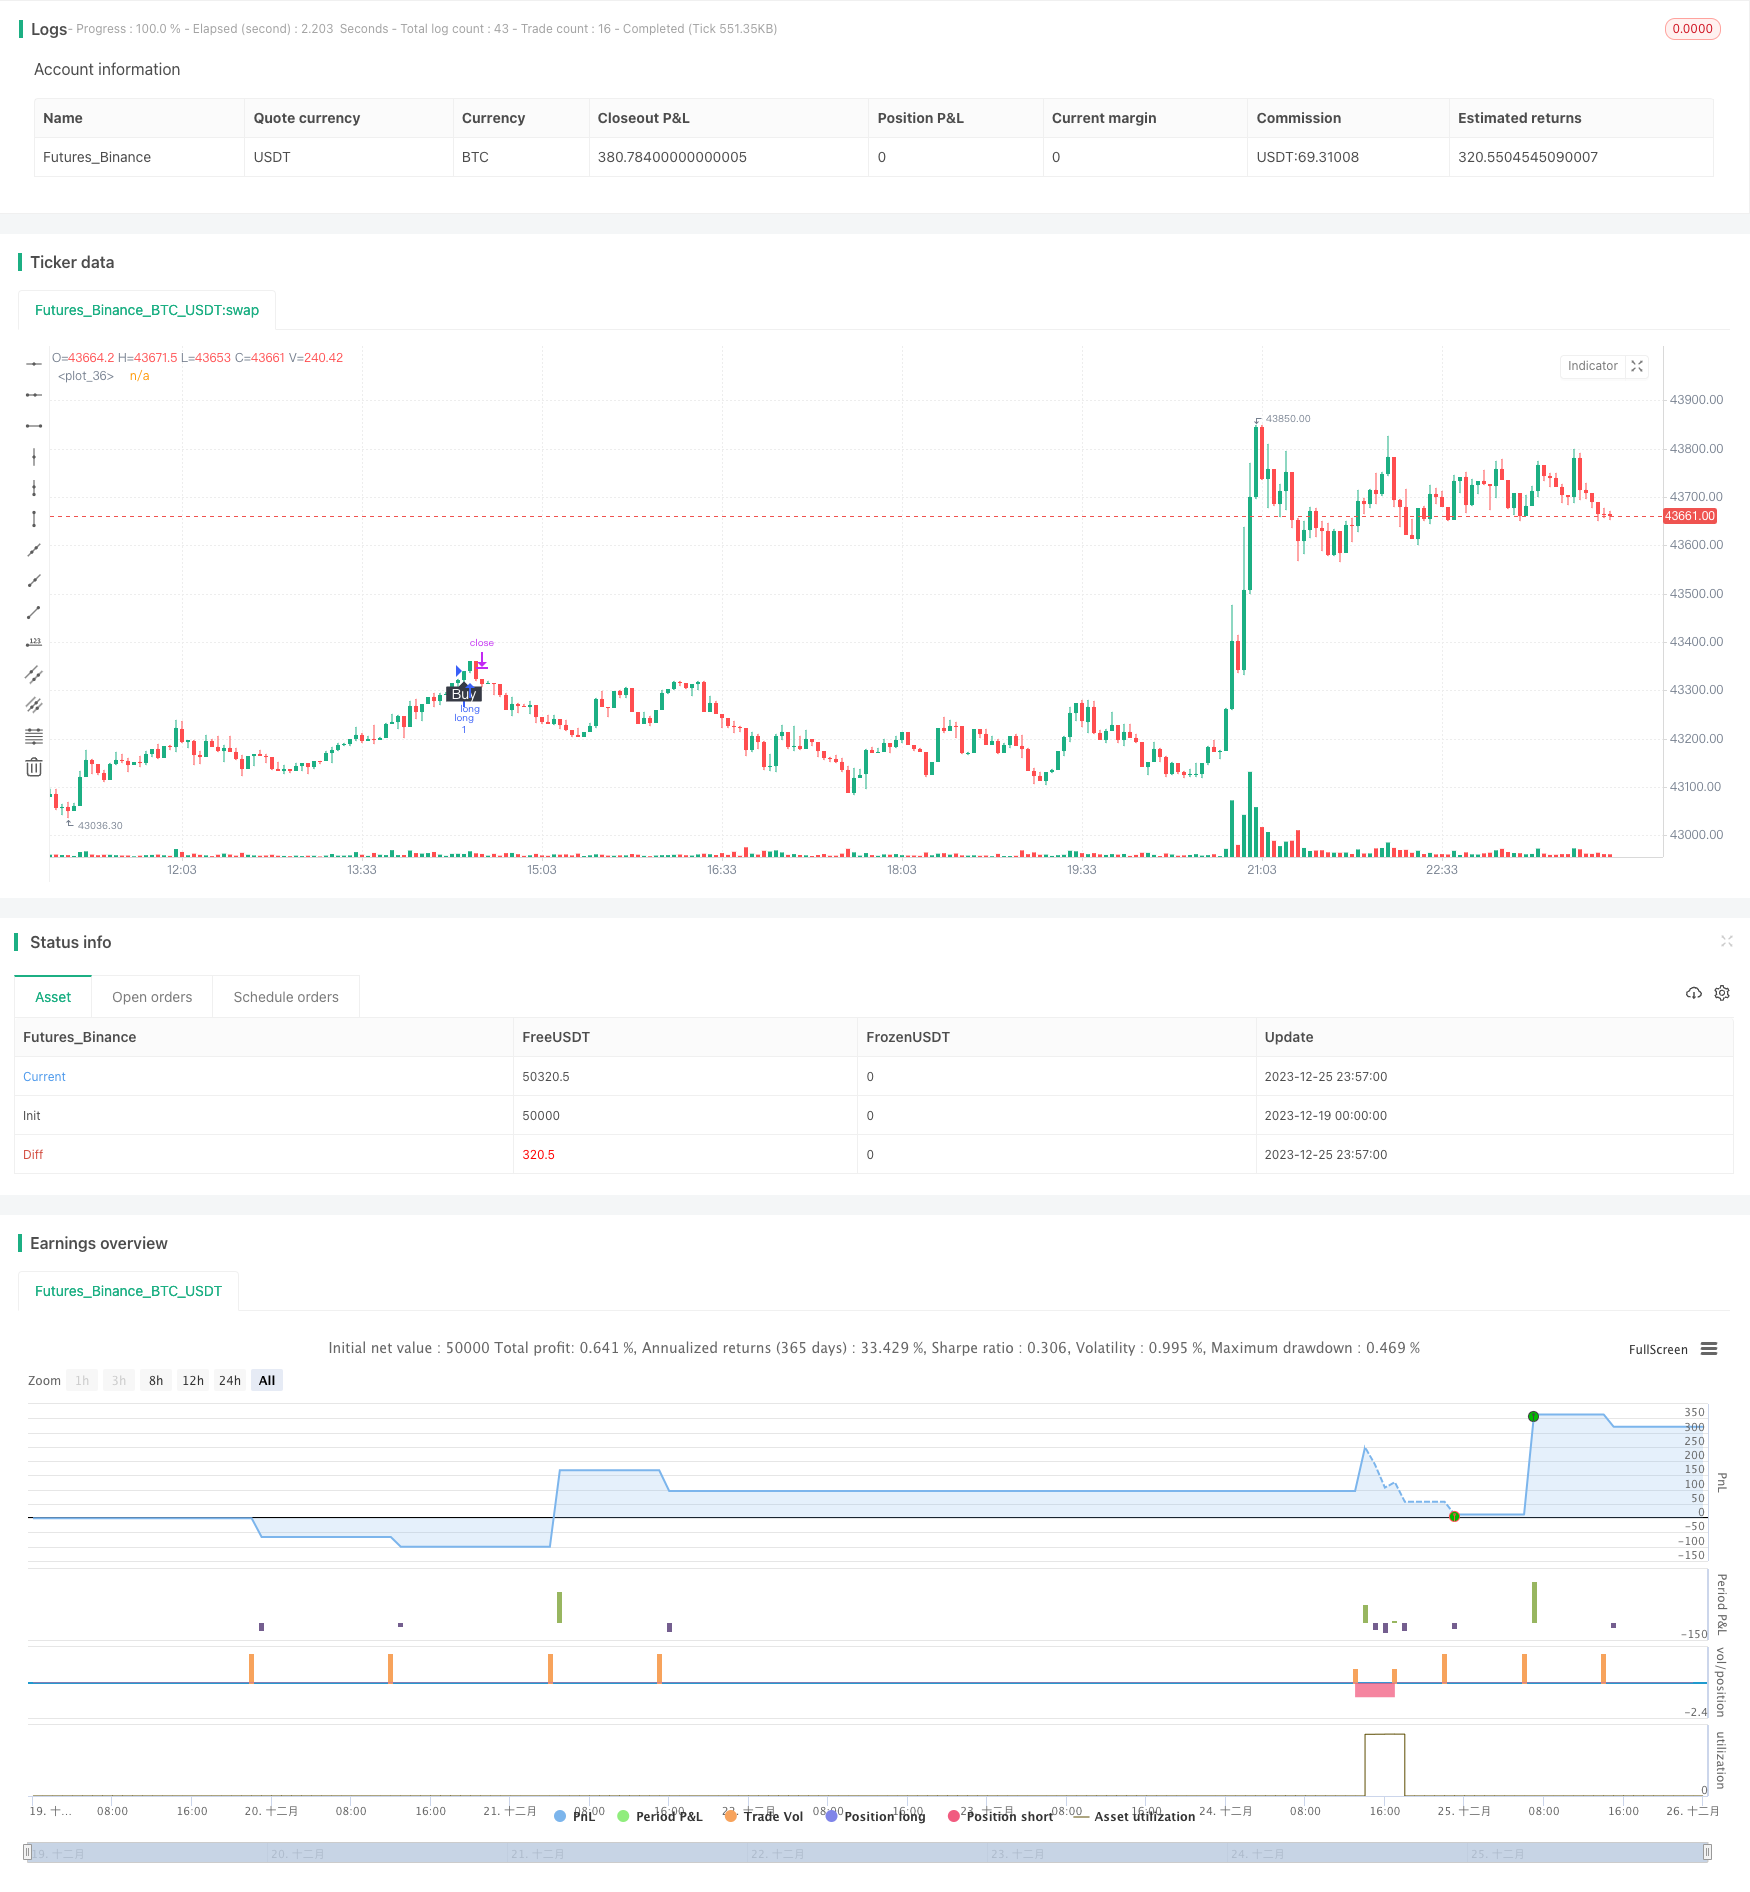
策略原理
该策略主要依赖RSI指标判断行情。RSI指标基于一定周期内收盘价的变化计算得出,它反映了股票的买卖力道。当RSI上穿设定的上阈值(默认75)时,表示股票进入超买区域;当RSI下穿设定的下阈值(默认25)时,表示股票进入超卖区域。
策略判断规则:
- 当RSI上穿上阈值时,做空;
- 当RSI下穿下阈值时,做多;
- 止损或止盈后平仓。
其交易逻辑简单清晰,参考参数设定合理,可配置空间大,适合用来捕捉行情中的较大趋势。
优势分析
该策略具有如下优势:
- 逻辑简单,容易理解和实现;
- 参考参数设定合理,可进行个性化配置;
- 可配置反转交易逻辑,灵活应对行情;
- 能有效识别价格反转点,捕捉大趋势。
总体来说,该策略参考参数设定合理,实现简单,通过RSI指标可有效判断价格反转,适合中长线捕捉行情大趋势,是一款易于掌握使用的量化策略。
风险分析
尽管该策略较为简单可靠,我们也不能忽视其面临的潜在风险:
- RSI指标发出错误信号的概率较大。RSI并不能完美预测价格反转,可能出现误判。
- 趋势行情中连续止损的可能。RSI指标难以区分正常范围调整与趋势反转。
- 震荡行情中亏损较多。RSI指标无法有效判断震荡走势,此环境下策略损失加大。
为控制风险,我们需要注意以下几点:
- 适当调整参数,防止误判率过高;
- 结合其他指标确认交易信号,提高准确性;
- 加大止盈比例,减小单笔止损;
- 注意规避震荡行情的交易。
优化方向
考虑到该策略主要面临反转误判和震荡行情亏损的风险,我们可以从以下几个方面进行优化:
- 结合其他指标进行信号过滤。例如KDJ、MACD等指标可发挥过滤作用,避免误判。
- 增加条件单次止损额度。适当放大单次止损空间,有助于策略跟大趋势运行。
- 设定开仓频率限制。加入每定周期只做一次或N次交易的逻辑閾値,可控制过于密集开仓。
- 设置行情状态判断。判断策略只在趋势行情下运行,避开震荡行情,可大幅优化策略收益风险比。
总结
双向RSI突破策略总体而言是一个简单实用的量化策略。它通过RSI指标判断价格反转,实现了简单的趋势跟踪。尽管存在一定误判风险,但可通过参数调整和信号过滤进行优化,在捕捉中长线趋势中发挥重要作用。其逻辑简明,适合量化交易的初学者参考学习。通过优化应用,本策略可望获取较为稳定的量化收益。
策略源码
/*backtest
start: 2023-12-19 00:00:00
end: 2023-12-26 00:00:00
period: 3m
basePeriod: 1m
exchanges: [{"eid":"Futures_Binance","currency":"BTC_USDT"}]
*/

//@version=4
strategy("RSI Algo", overlay=true)

// Calculate start/end date and time condition
DST = 1 //day light saving for usa
//--- Europe
London = iff(DST==0,"0000-0900","0100-1000")
//--- America
NewYork = iff(DST==0,"0400-1500","0500-1600")
//--- Pacific
Sydney = iff(DST==0,"1300-2200","1400-2300")
//--- Asia
Tokyo = iff(DST==0,"1500-2400","1600-0100")

//-- Time In Range
timeinrange(res, sess) => time(res, sess) != 0

london = timeinrange(timeframe.period, London)
newyork = timeinrange(timeframe.period, NewYork)

time_cond = true


myPeriod = input(defval=14, type=input.integer, title="Period")
myThresholdUp = input(defval=75, type=input.float, title="Upper Threshold")
myThresholdDn = input(defval=25, type=input.float, title="Lower Threshold")
myAlgoFlipToggle = input(defval=false, type=input.bool, title="Imverse Algorthim")
myLineToggle = input(defval=true, type=input.bool, title="Show Lines")
myLabelToggle = input(defval=true, type=input.bool, title="Show Labels")
myRSI=rsi(close, myPeriod)
buy = myAlgoFlipToggle ? falling(myRSI,1) and cross(myRSI, myThresholdDn) : rising(myRSI, 1) and cross(myRSI,myThresholdUp) //and time_cond
sell = myAlgoFlipToggle ? rising(myRSI, 1) and cross(myRSI,myThresholdUp) : falling(myRSI,1) and cross(myRSI, myThresholdDn) //and time_cond
myPosition = 0
myPosition := buy==1 ? 0 : sell==1 or myPosition[1]==1 ? 1 : 0
trendColor = buy ? color.red : sell ? color.green : na
plot(myLineToggle ? buy and myPosition[1]==1 ? low - 0.004: sell and myPosition[1]==0 ? high + 0.004 : na : na, color=trendColor, style=plot.style_line, linewidth=4, editable=false)
plotshape(myLabelToggle ? buy and myPosition[1]==1 ? low - 0.005 : na : na, style=shape.labelup, location=location.absolute, text="Buy", transp=0, textcolor = color.white, color=color.black, editable=false)
plotshape(myLabelToggle ? sell and myPosition[1]==0 ? high + 0.005 : na : na, style=shape.labeldown, location=location.absolute, text="Sell", transp=0, textcolor = color.white, color=color.black, editable=false)

strategy.initial_capital = 50000
    //Calculate the size of the next trade
balance = strategy.netprofit + strategy.initial_capital //current balance
floating = strategy.openprofit          //floating profit/loss
risk = input(2,type=input.float,title="Risk %")/100           //risk % per trade
isTwoDigit = input(false,"Is this a 2 digit pair? (JPY, XAU, XPD...")


stop = input(250, title="stop loss pips")
tp = input(2500, title="take profit pips")
if(isTwoDigit)
    stop := stop/100

temp01 = balance * risk     //Risk in USD
temp02 = temp01/stop        //Risk in lots
temp03 = temp02*100000      //Convert to contracts
size = 1

strategy.entry("long",1,size,when=buy and myPosition[1]==1 )
strategy.entry("short",0,size,when=sell and myPosition[1]==0)

strategy.exit("exit_long","long",loss=stop, profit=tp)      //Long exit (stop loss)
strategy.exit("exit_short","short",loss=stop, profit=tp)      //Short exit (stop loss)

//strategy.close_all(when= not time_cond)