一、策略概述
本策略名称为“基于K线收盘价多空比较与EMA过滤的量化交易策略”。该策略通过统计最近一定周期内K线的收盘价构成的多头K线和空头K线的数量,结合EMA的过滤,在符合交易时间段的情况下判断做多做空信号。
二、策略原理
该策略的核心逻辑是统计最近lookback周期内出现上涨收盘的K线数量upCloseCount和下跌收盘的K线数量downCloseCount,如果上涨收盘的数量更多则判断为多头市场,如果下跌收盘的数量更多则判断为空头市场。同时结合EMA指标判断价格趋势和作为过滤器,只有当价格高于EMA时才考虑做多,价格低于EMA时才考虑做空。此外,策略还设置了交易时间段session1和session2,只在这两个时间段内交易。
具体判断逻辑是:
多头信号触发条件:inSession为true(在交易时间段内)且upCloseCount > downCloseCount(上涨收盘K线数量较多)且close > ema(收盘价高于EMA)且currentSignal不为”long”(当前无持仓)
空头信号触发条件:inSession为true且downCloseCount > upCloseCount(下跌收盘K线数量较多)且close < ema(收盘价低于EMA)且currentSignal不为”short”(当前无持仓)
三、策略优势分析
- 通过统计一定历史周期内K线收盘价的多空比较判断价格趋势和市场心理,具有一定的趋势跟随效果
- 结合EMA指标对价格趋势进行过滤,避免在震荡行情中错误交易
- 设置特定的交易时间段,避免在非主要交易时间段的杂音行情中交易
- 兼顾趋势和频繁交易之间的平衡
四、策略风险分析
- 在横盘整理的行情中,收盘价的多空比较容易受到误导,导致不必要的亏损
- EMA参数设置不当也会导致滤波效果不佳
- 交易时间段设置不当,会失去大量交易机会或者误交易
- 突发事件引起的Gap行情无法有效跟踪
对策:
1. 优化EMA参数,寻找最佳平衡
2. 优化交易时间段
3. 结合止损策略控制单笔亏损
五、策略优化方向
- 对交易时间段进行优化,找到最佳交易时间段
- 对EMA周期和平滑度进行参数优化
- 增加基于ATR的止损机制
- 增加对突发事件的识别模块,避免Gap行情的风险
- 考虑与其他指标组合,寻找更好的过滤入场条件
- 测试不同品种表现差异,根据差异调整参数
六、总结
本策略通过统计一定历史周期内K线收盘价构成的多头和空头K线数量,结合EMA指标的过滤效果,在设置的特定交易时间段识别趋势信号。具有一定的跟踪趋势效果。但也存在一定的误交易风险,需要通过参数优化、止损策略、信号过滤等方法进行改进,在回测中验证效果。
策略源码
/*backtest
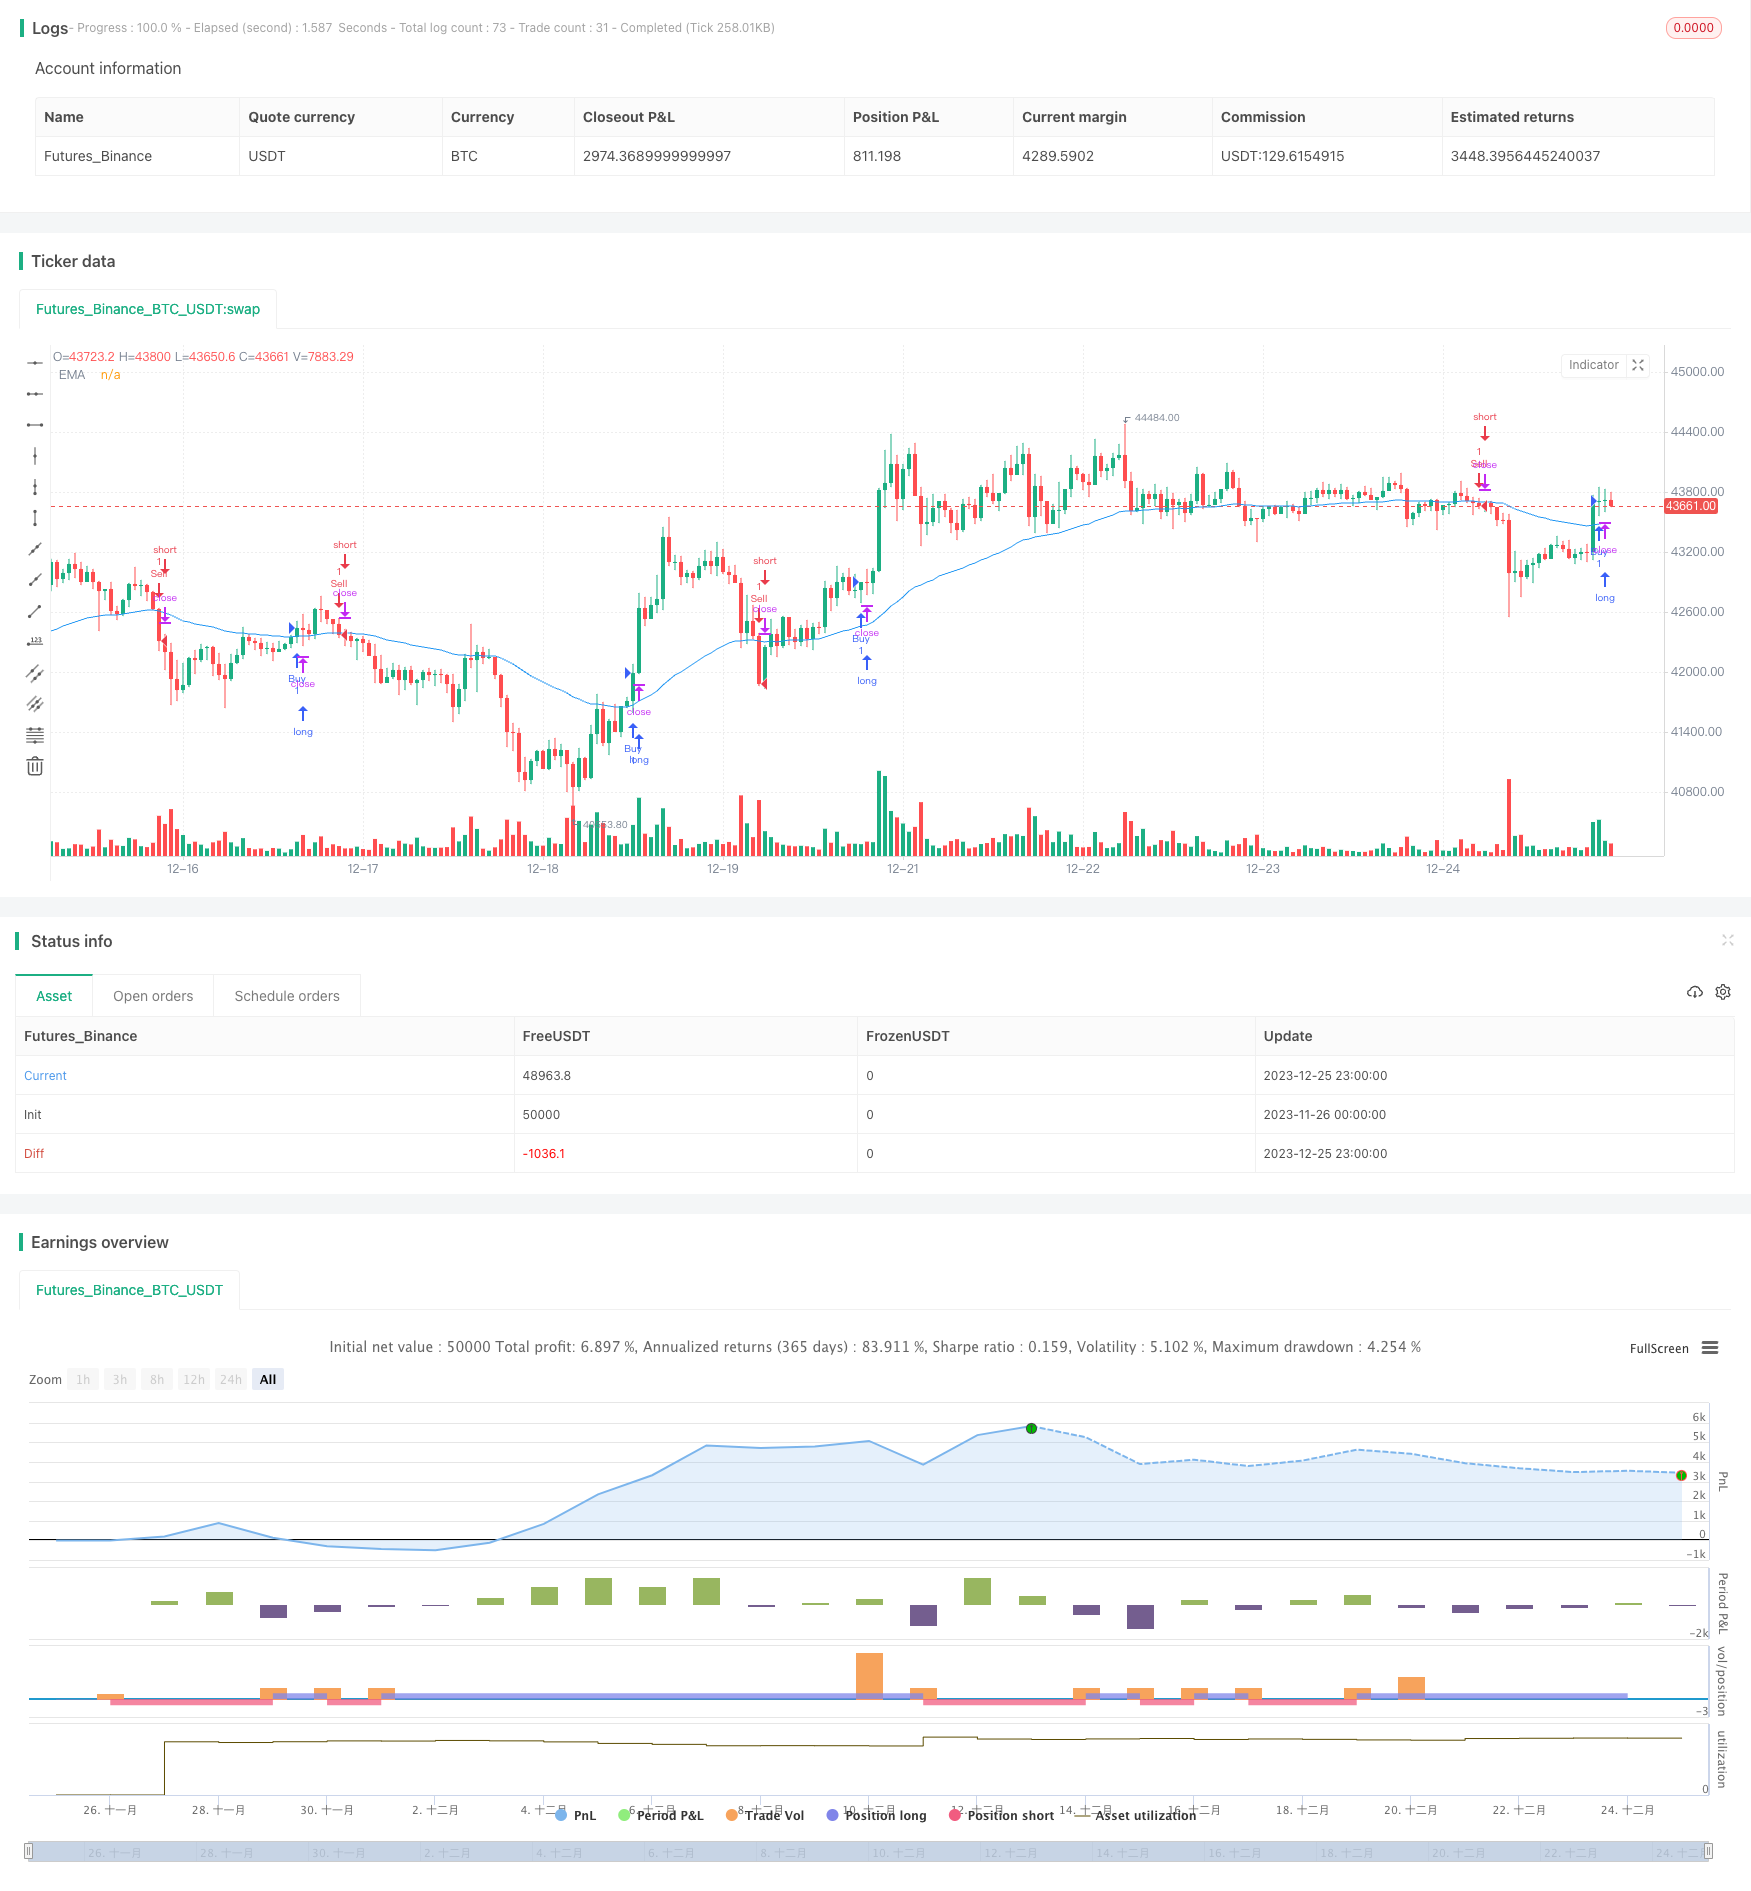
start: 2023-11-26 00:00:00
end: 2023-12-26 00:00:00
period: 1h
basePeriod: 15m
exchanges: [{"eid":"Futures_Binance","currency":"BTC_USDT"}]
*/
//@version=5
strategy("Up vs Down Close Candles Strategy with EMA and Session Time Frames", shorttitle="UvD Strat EMA Session", overlay=true)
// User input to define the lookback period, EMA period, and session strings for time frames
int lookback = input(20, title="Lookback Period")
int emaPeriod = input(50, title="EMA Period")
string session1 = input("0900-1200", title="Time Frame 1 Session")
string session2 = input("1300-1600", title="Time Frame 2 Session")
// Calculate the EMA
float ema = ta.ema(close, emaPeriod)
// State variable to track the current signal
var string currentSignal = na
// Counting up-close and down-close candles within the lookback period
int upCloseCount = 0
int downCloseCount = 0
if barstate.isnew
upCloseCount := 0
downCloseCount := 0
for i = 0 to lookback - 1
if close[i] > close[i + 1]
upCloseCount += 1
else if close[i] < close[i + 1]
downCloseCount += 1
// Define the long (buy) and short (sell) conditions with EMA filter and session time frame
bool inSession = time(timeframe.period, session1) or time(timeframe.period, session2)
bool longCondition = inSession and upCloseCount > downCloseCount and close > ema and currentSignal != "long"
bool shortCondition = inSession and downCloseCount > upCloseCount and close < ema and currentSignal != "short"
// Enter or exit the market based on conditions
if longCondition
currentSignal := "long"
strategy.entry("Buy", strategy.long)
if shortCondition
currentSignal := "short"
strategy.entry("Sell", strategy.short)
// Exit logic for long and short positions
if currentSignal == "long" and strategy.position_size <= 0
strategy.close("Sell")
if currentSignal == "short" and strategy.position_size >= 0
strategy.close("Buy")
plot(ema, color=color.blue, title="EMA")