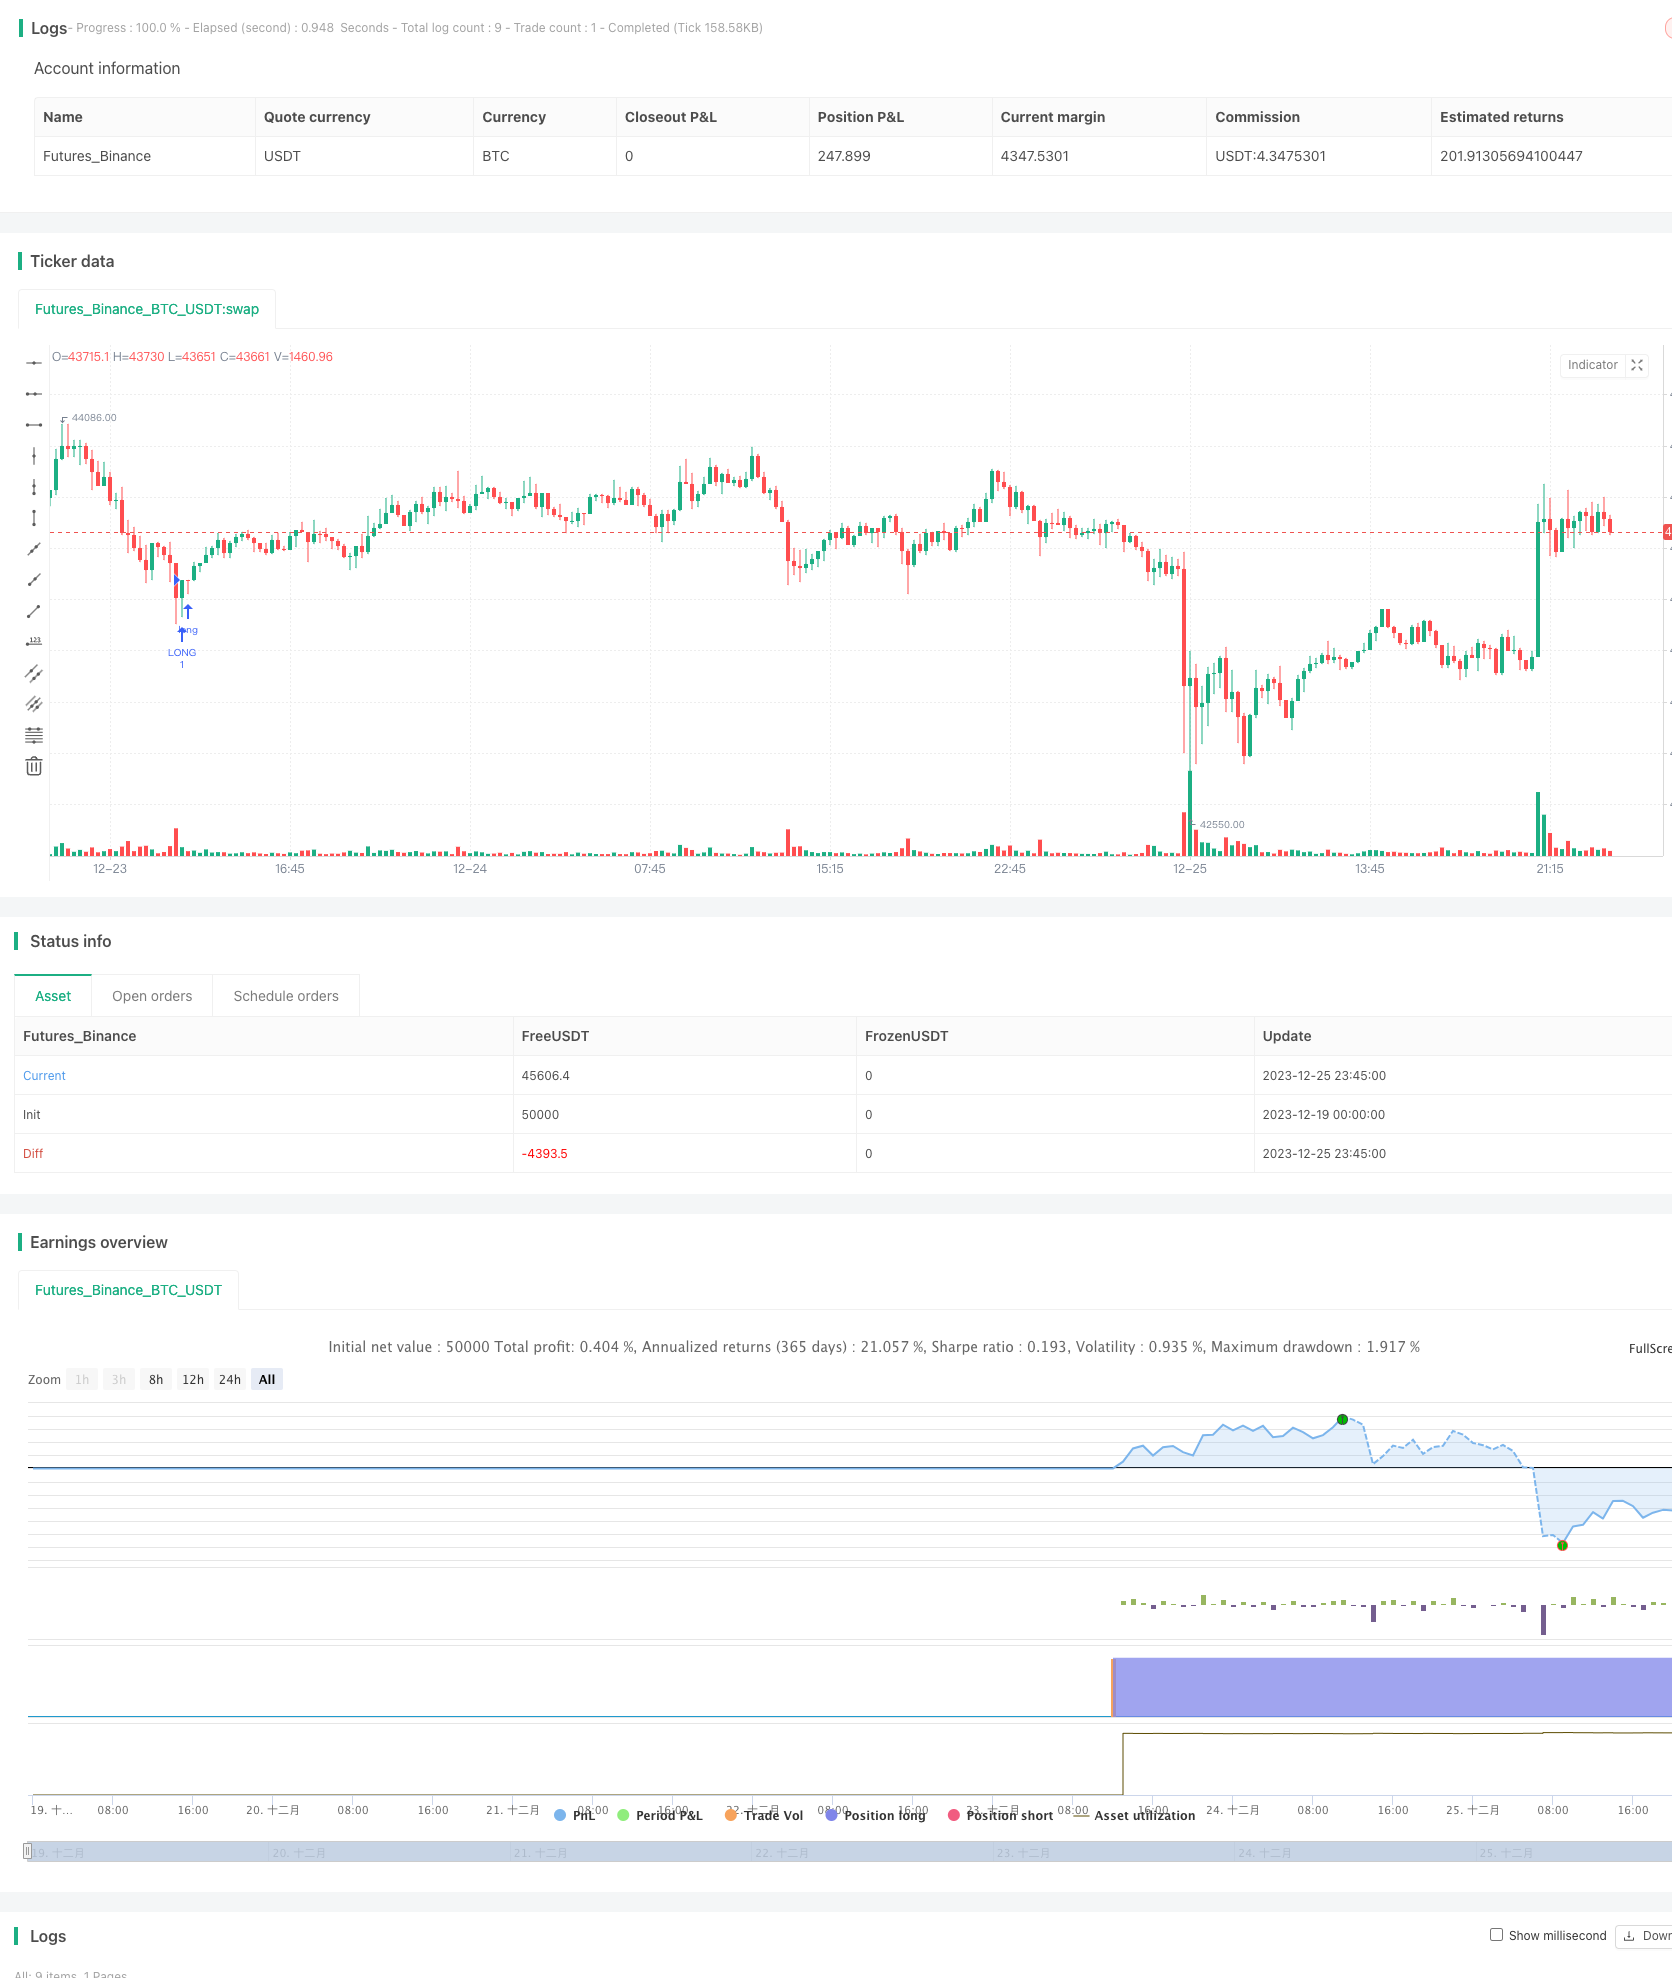
概述
本策略采用经典的随机慢速指标策略与相对强弱指标策略的组合,形成一种双重策略。当随机指标超过80时看空,低于20时看多;同时当RSI超过70时看空,低于30时看多,只有两者同时触发时,才会打开仓位。
策略原理
本策略主要基于两种经典指标 - 随机慢速指标与RSI指标,并设置阈值判断超买超卖状态。
随机慢速指标部分:
- 设置Stochlength为14,为计算随机指标的lookback长度
- 设置StochOverBought为80,StochOverSold为20,作为判断超买超卖的阈值
- 设置smoothK为3,smoothD为3,分别为%K线与%D线的平滑参数
计算出的%K线与%D线在代码中被命名为k与d。
当%K线从下向上突破%D线时为看多信号。当从上向下跨越时为看空信号。同时结合超买超卖判断,可用于判断机会。
RSI部分:
- 设置RSIlength为14,为计算RSI指标的lookback长度
- 设置RSIOverBought为70,RSIOverSold为30,作为判断超买超卖的阈值
计算得到的RSI指标命名为vrsi。
当RSI指标上扬超过70为超买信号,下跌低于30为超卖信号。
双重策略触发条件:
只有当随机指标和RSI指标同时显示超买或超卖信号时,也就是都超过各自的阈值,本策略才会打开仓位。
这种组合使用了两种指标的互补,可以减少假信号,提高信号的可靠性。
优势分析
这种双重策略组合,融合了随机慢速指标与RSI指标两种经典策略,具有以下优势:
- 双重指标组合,可以互相验证,减少假信号,提高信号质量与可靠性
- 随机指标判断超买超卖状况,RSI也判断超买超卖状况,两者结合使结果更加可靠准确
- 随机指标采用%K与%D的方式,平滑参数可调,避免被 einzelnen极端值影响
- RSI指标反应比较迅速,随机指标判断中长期趋势和转折点,两者结合使策略更完整
- 交易风格保守,只在指标双双显示时才开仓,避免冒进,减少交易频率
风险及解决
本策略也存在一些风险,主要有:
- 参数设置风险
阈值参数设置不当可能导致错失良机或产生假信号。可以通过优化和反复测试找到最佳参数。
- 双重策略信号不足
由于双重策略,信号产生频率会比较低,仓位利用率不高。可以适当放宽参数,增加信号数量。
- 指标滞后问题
随机指标和RSI指标都存在一定滞后,可能错过快速变化的机会。可以结合更加灵敏的指标进行辅助。
- 特定品种不适用问题
本策略更适用于一些比较稳定、波动更为剧烈的品种,如股指、贵金属等。对于一些波动较小的品种可能不太适用。
优化思路
本策略还可从以下几个方面进行优化:
- 参数优化
可以通过算法自动优化或手工优化的参数,找到最佳参数组合。
- 增加止损机制
可设置移动止损或百分比止损,控制单笔损失。
- 结合其他指标
可再引入量能指标、移动平均线等作为辅助判断信号质量的指标。
- 适当放宽双重策略条件
可适当放宽双重策略的触发阈值,增加信号数量。
总结
本策略采用随机慢速指标和RSI指标的双重组合,当两者同时显示超买超卖信号时触发,具有信号准确可靠性高、交易风格保守等优点。也存在一些参数设置风险、信号数量较少等问题。我们可以通过参数优化、止损设置、引入其他指标等方式进行改良与优化,使策略更加稳定可靠。
/*backtest
start: 2023-12-19 00:00:00
end: 2023-12-26 00:00:00
period: 15m
basePeriod: 5m
exchanges: [{"eid":"Futures_Binance","currency":"BTC_USDT"}]
*/

//@version=2
strategy("Stochastic + RSI, Double Strategy (by ChartArt)", shorttitle="CA_-_RSI_Stoch_Strat", overlay=true)

// ChartArt's Stochastic Slow + Relative Strength Index, Double Strategy
//
// Version 1.0
// Idea by ChartArt on October 23, 2015.
//
// This strategy combines the classic RSI
// strategy to sell when the RSI increases
// over 70 (or to buy when it falls below 30),
// with the classic Stochastic Slow strategy
// to sell when the Stochastic oscillator
// exceeds the value of 80 (and to buy when
// this value is below 20).
//
// This simple strategy only triggers when
// both the RSI and the Stochastic are together
// in overbought or oversold conditions.
//
// List of my work:
// https://www.tradingview.com/u/ChartArt/


///////////// Stochastic Slow
Stochlength = input(14, minval=1, title="lookback length of Stochastic")
StochOverBought = input(80, title="Stochastic overbought condition")
StochOverSold = input(20, title="Stochastic oversold condition")
smoothK = input(3, title="smoothing of Stochastic %K ")
smoothD = input(3, title="moving average of Stochastic %K")
k = sma(stoch(close, high, low, Stochlength), smoothK)
d = sma(k, smoothD)


///////////// RSI
RSIlength = input( 14, minval=1 , title="lookback length of RSI")
RSIOverBought = input( 70  , title="RSI overbought condition")
RSIOverSold = input( 30  , title="RSI oversold condition")
RSIprice = close
vrsi = rsi(RSIprice, RSIlength)


///////////// Double strategy: RSI strategy + Stochastic strategy

if (not na(k) and not na(d))
    if (crossover(k,d) and k < StochOverSold)
        if (not na(vrsi)) and (crossover(vrsi, RSIOverSold))
            strategy.entry("LONG", strategy.long, comment="StochLE + RsiLE")


if (crossunder(k,d) and k > StochOverBought)
    if (crossunder(vrsi, RSIOverBought))
        strategy.entry("SHORT", strategy.short, comment="StochSE + RsiSE")


//plot(strategy.equity, title="equity", color=red, linewidth=2, style=areabr)WQQQQQQQQQQQQQQQQQQQQQQQQQQQQQQQQQQQQQQQ