概述
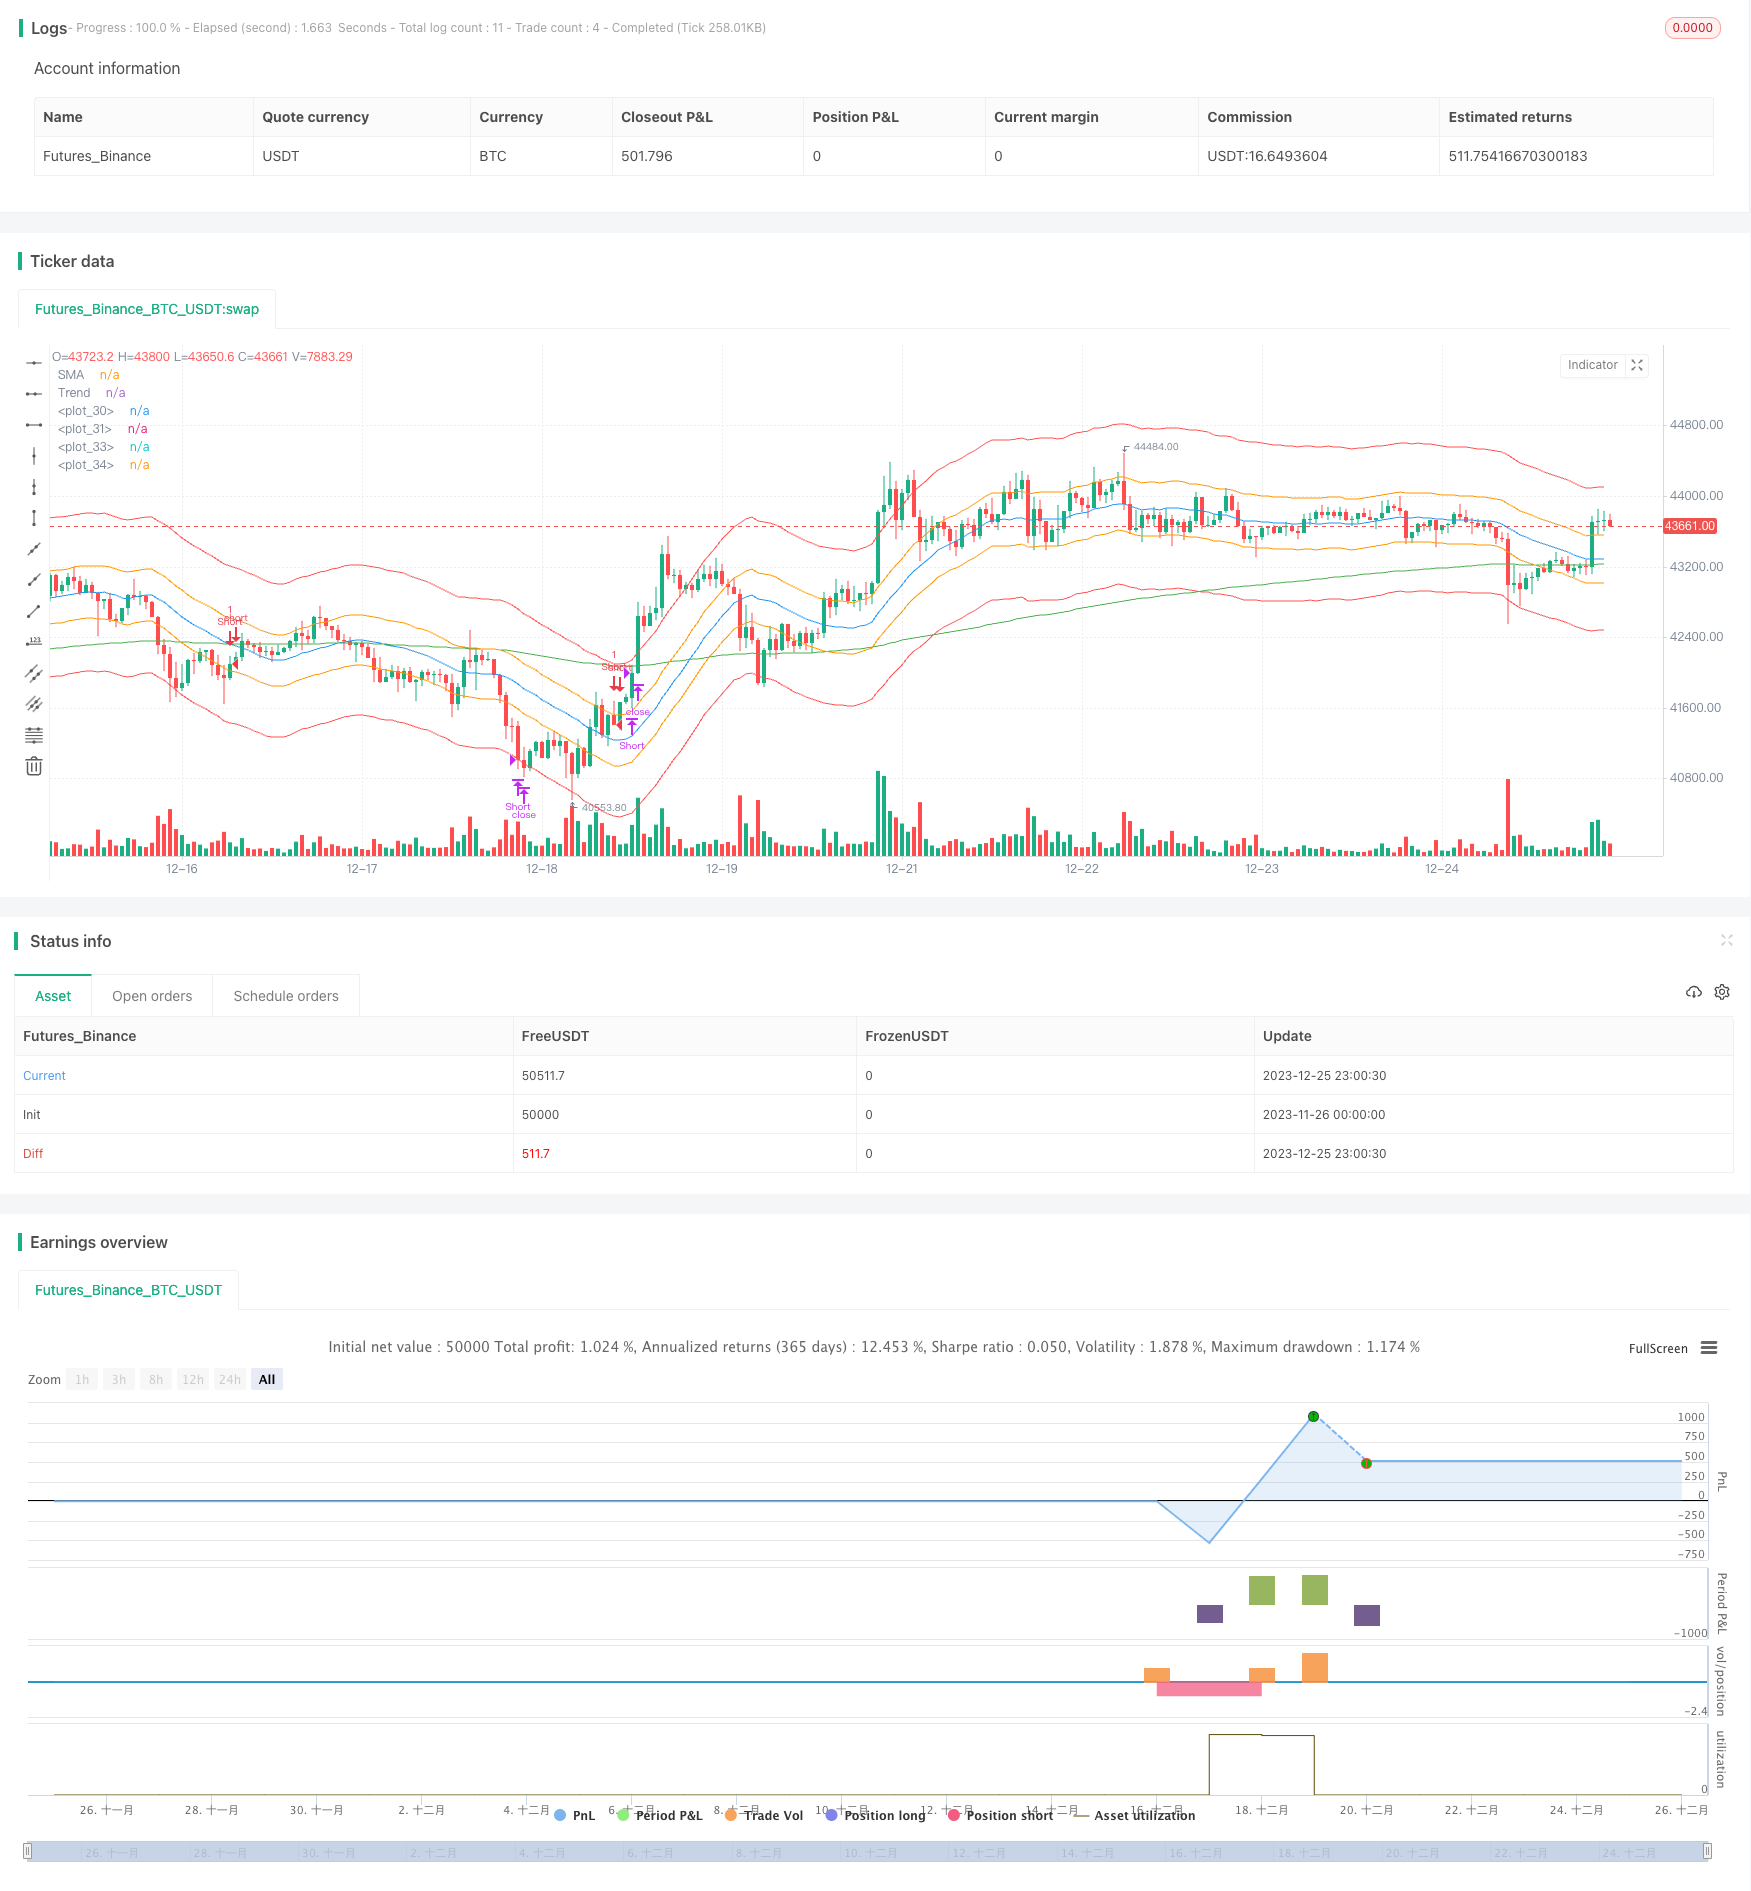
该策略是一个基于日本蜡烛技术分析的快速跳空策略,同时结合均线指标和支撑阻力指标来判断趋势和位置。其主要思想是在均线和趋势指标确认之后,等待价格快速跳空并迅速止盈。
策略原理
该策略使用长度为20的简单移动平均线SMA和长度为200的指数移动平均线EMA来判断趋势方向。当价格在上升趋势时(SMA在EMA之上),并且当前日本蜡烛实体收盘价高于开盘价(白色实体),表明多头力量增强;当价格在下降趋势时(SMA在EMA之下),并且当前日本蜡烛实体收盘价低于开盘价(黑色实体),表明空头力量增强。
在趋势和力量得到确认的情况下,该策略等待价格快速跳空,进入场内。所谓“跳空”就是价格“跨过”预设的三条ATR通道(以200日ATR和系数为基准计算出来的通道)中的第一条通道线,进入第二条通道线以内。这是一个高概率的突破信号。
进场后,止盈或止损规则非常简单。只要价格触及通道的外沿(如上涨止盈线或下跌止损线),就会立即止盈或止损。这保证了策略的快速获利。
策略优势
该策略最大的优势在于获利快而保守。使用快速跳空的方式进入场内,避免多次调整仓位。而通道突破带来的趋势加速效应,则可在短时间内获得较大利润。
相比于长线持有,如此高效的开平仓手法可显著降低策略的空仓率,进一步提升资金使用效率。同时,快速止盈止损机制也可有效控制单笔亏损。
策略风险
该策略主要依赖均线指标判断趋势方向,存在回调和震荡的风险。当价格在通道内部震荡时,则可能导致超短线反向开仓和亏损。
此外,该策略过于依赖技术指标,没有结合基本面和重大事件分析。一旦发生黑天鹅事件,则技术指标QIAN失效,策略可能遭遇较大亏损。
为控制风险,可适当放宽通道范围,降低开仓频率。或者增加仓位管理模块,根据资金规模动态调整单笔仓位。
策略优化
该策略可从以下几个方面进行优化:
增加仓位管理模块。根据账户资金规模,动态调整每单开仓数量,控制单笔亏损占比。
增加基本面过滤。在技术指标触发开仓条件时,判断公司基本面和重大事件,避免异动。
结合股票池管理。设定股票筛选规则,动态调整股票池。不同阶段选择最优股票池,提高稳定性。
结合机器学习模型。通过AI预测趋势和关键价格点,辅助确定通道范围和开仓时机。
总结
该策略以简洁高效见长。使用均线判断大趋势,日本蜡烛判断力量方向,快速跳空入场,迅速止盈止损。可在短期内获利,适合高频交易。但也存在回撤和不确定性风险。通过持续优化,可使策略在不同市场环境下稳定运行。
/*backtest
start: 2023-11-26 00:00:00
end: 2023-12-26 00:00:00
period: 1h
basePeriod: 15m
exchanges: [{"eid":"Futures_Binance","currency":"BTC_USDT"}]
*/

//@version=2
strategy("Kana with S/R Strategy", title = "KANA with S/R", overlay=true)

len = input(20, minval=1, title="Length")
multiplier1 = input(1, minval=1, title="multiplier1")
multiplier2 = input(2, minval=1, title="multiplier2")
multiplier3 = input(3, minval=1, title="multiplier3")
srTimeFrame = input(240, minval=1, title="Support Resistance TimeFrame")
useSR = input(true, type = bool, title="Use Support/Resistance")
tpPercent = input(0.5, type=float, title = "Take Profit Percent")
useTP = input(false, type=bool, title = "Use Take Profit")
tp = (close * tpPercent / 100) / syminfo.mintick

src = input(close, title="Source")
mid = sma(src, len)
plot(mid, title="SMA", color=blue)

trend = ema(close, 200)
plot(trend, title="Trend", color=green)


upper1 = mid + atr(200) * multiplier1
upper2 = mid + atr(200) * multiplier2
upper3 = mid + atr(200) * multiplier3

lower1 = mid - atr(200) * multiplier1
lower2 = mid - atr(200) * multiplier2
lower3 = mid - atr(200) * multiplier3

plot(upper1, color = orange)
plot(upper3, color = red)

plot(lower1, color = orange)
plot(lower3, color = red)

haClose = request.security(heikinashi(syminfo.tickerid), timeframe.period, close)
haOpen = request.security(heikinashi(syminfo.tickerid), timeframe.period, open)

resistance = request.security(syminfo.tickerid,tostring(srTimeFrame), high)
support  = request.security(syminfo.tickerid,tostring(srTimeFrame), low)
rsPos = (close - support[srTimeFrame]) / (resistance[srTimeFrame] - support[srTimeFrame])

MACD = ema(close, 120) - ema(close, 260)
aMACD = ema(MACD, 90)
hisline = MACD - aMACD

longCondition = (mid > trend) and (haOpen[1] < haClose[1]) and (mid > mid[1]) and (close < upper1) and hisline > 0 and (useSR == true ? (rsPos > 100) : true)
shortCondition = (mid < trend) and (haOpen[1] > haClose[1]) and (mid < mid[1]) and (close > lower1) and hisline < 0 and (useSR == true ? (rsPos < 0) : true)

longExit = (close > upper3 ) or (close < lower2)
shortExit = (close < lower3) or (close > upper2)

if (longCondition)
    strategy.entry("Long", strategy.long)
    if (useTP)
        strategy.exit("Exit Long", "Long", profit = tp)

if (longExit)
    strategy.close("Long")

if (shortCondition)
    strategy.entry("Short", strategy.short)
    if (useTP)
        strategy.exit("Exit Short", "Short", profit = tp)

if (shortExit)
    strategy.close("Short")