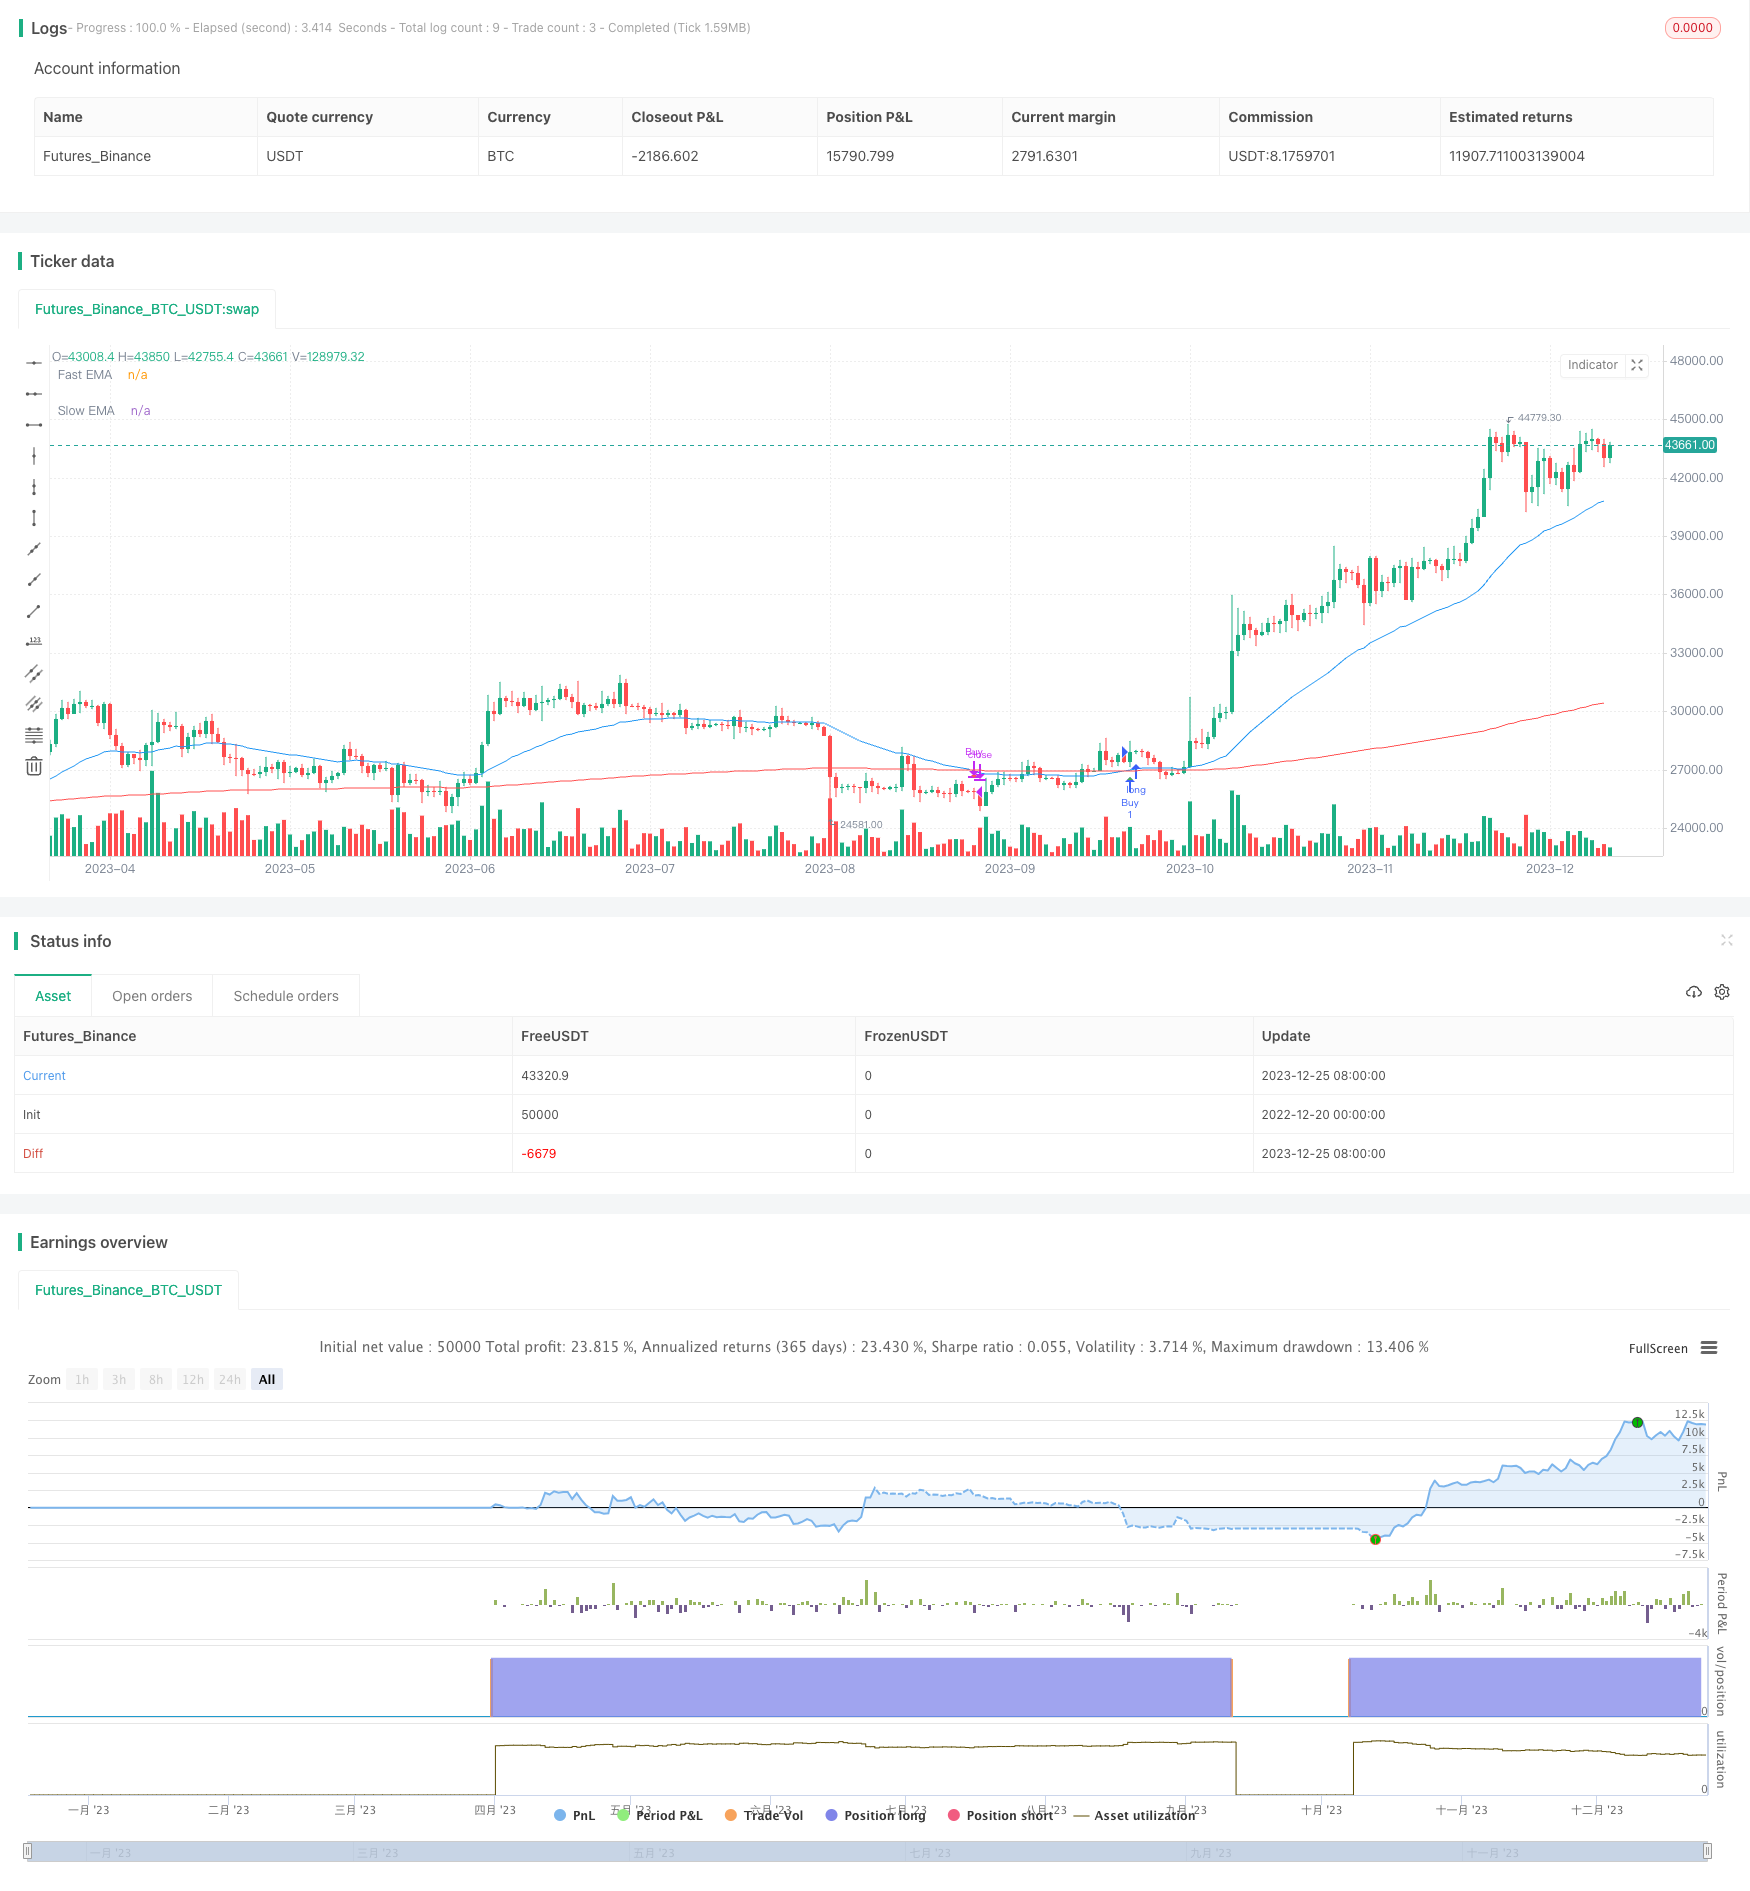
fast EMA and slow EMA Momentum Breakthrough Strategy

Author: ChaoZhang, Date: 2023-12-27 16:35:04
Tags:

img

Overview

This strategy generates buy and sell signals by calculating fast EMA and slow EMA, and going long when the fast EMA crosses above the slow EMA, and going short when the fast EMA crosses below the slow EMA to make profits. This strategy belongs to momentum tracking strategy.

Strategy Principle

This strategy mainly utilizes the smoothing concept of the EMA indicator. EMA stands for Exponential Moving Average, which is a technical indicator that uses historical price trends to predict future price trends. The EMA indicator consists of a fast line and a slow line, where the fast line is more sensitive to recent price changes and the slow line is more sensitive to historical price changes. When short-term price fluctuations exceed a certain level, the fast line will cross above or below the slow line, generating buy or sell signals.

Specifically, this strategy chooses an EMA with a length of 37 as the fast line, and an EMA with a length of 175 as the slow line. It generates a buy signal when the fast line crosses above the slow line for going long, and it generates a sell signal when the fast line crosses below the slow line for going short. It realizes stop loss or take profit after going long by the slow line crossing below the fast line.

Strategy Advantages

This EMA crossover strategy has the following advantages:

  1. Simple principle, easy to understand and implement
  2. Can effectively capture short-term trends in the market
  3. Relatively low pullback risk contro
  4. The EMA periods can be adjusted to adapt to different products

Strategy Risks

This strategy also has some potential risks:

  1. Prone to generating false signals, may enter too early or too late
  2. EMA indicator lags, may miss key turning points
  3. Easy to be stopped out in range-bound markets
  4. Backtesting overfitting risk, questionable effect in live trading

To reduce these risks, we can consider optimizing the timing of entries, setting stop loss levels, combining with other indicators for filtration and so on.

Strategy Optimization Directions

There is room for further optimization of this strategy:

  1. Optimize EMA period parameters to adapt to different product characteristics
  2. Add volume indicator filters to avoid wrongly entering during market swings
  3. Set up moving stop loss, gradually adjust stop loss level according to the trend
  4. Combine with volatility indicators to dynamically adjust position size based on market volatility

Summary

In general, this simple EMA crossover strategy is easy for beginners to grasp. But its actual effect needs practical verification, and investors should also be aware of the risks of backtest overfitting when using it. By optimizing parameters, combining indicators, etc., the stability and practical effect of this strategy can be further enhanced.


/*backtest
start: 2022-12-20 00:00:00
end: 2023-12-26 00:00:00
period: 1d
basePeriod: 1h
exchanges: [{"eid":"Futures_Binance","currency":"BTC_USDT"}]
*/

// This Pine Scriptâ„¢ code is subject to the terms of the Mozilla Public License 2.0 at https://mozilla.org/MPL/2.0/
// © umerhafeez37733

//@version=5
strategy("EMA Crossover Strategy", overlay=true)

// Input for EMA lengths
fastEmaLength = input(37, title="Fast EMA Length")
slowEmaLength = input(370, title="Slow EMA Length")

// Calculate EMAs
fastEma = ta.ema(close, fastEmaLength)
slowEma = ta.ema(close, slowEmaLength)

// Plot EMAs on the chart
plot(fastEma, title="Fast EMA", color=color.blue)
plot(slowEma, title="Slow EMA", color=color.red)

// Buy condition: Fast EMA crosses above Slow EMA
buyCondition = ta.crossover(fastEma, slowEma)

// Sell condition: Fast EMA crosses below Slow EMA
sellCondition = ta.crossunder(fastEma, slowEma)

// Plot Buy and Sell signals on the chart
plotshape(series=buyCondition, title="Buy Signal", color=color.green, style=shape.triangleup, location=location.belowbar)
plotshape(series=sellCondition, title="Sell Signal", color=color.red, style=shape.triangledown, location=location.abovebar)

// Execute strategy
strategy.entry("Buy", strategy.long, when=buyCondition)
strategy.close("Buy", when=sellCondition)


More