一、策略概述
本策略名称为“动量指标与SuperTrend组合交易策略”。该策略主要思想是将动量指标与SuperTrend指标进行组合,利用两种指标的优势实现更准确的 Entries 和 Exits。
具体来说,动量指标用于判断价格运动的加速或减速,判断趋势的变化。SuperTrend 用于判断价格是否突破上升或下降通道,判断趋势的变化。两者组合可以更准确地捕捉趋势的转折点。
二、策略详细原理
- 动量指标部分
计算价格的 N 日动量值,并计算动量值的 1 日动量。当 N 日动量 > 0 且 1 日动量 > 0 时,为做多信号;当 N 日动量 < 0 且 1 日动量 < 0 时,为做空信号。
- SuperTrend 指标部分
计算价格的 ATR 值,并根据 ATR 绘制上升通道线和下降通道线。当价格从下方突破上升通道时为做多信号,当价格从上方突破下降通道时为做空信号。
- entry logic
将动量指标的做多信号与 SuperTrend 的做多信号进行“与”操作,同时发生时为最终做多Entry信号;将动量指标的做空信号与 SuperTrend 的做空信号进行“与”操作,同时发生时为最终做空Entry信号。
三、策略优势分析
利用动量指标判断价格运动加速或减速,捕捉趋势转折点。
利用 SuperTrend 指标判断价格突破通道,捕捉突破点。
两种指标互相验证,可以减少假信号,提高 Entries 准确性。
结合两种指标的 Exit logic,可以实现趋势追踪退出,避免 premature exit。
四、策略风险分析
N 日动量指标参数设置不当可能导致错失趋势转折点。
SuperTrend 参数设置不当,通道绘制不准确,可能产生假信号。
两种指标互相验证,可能错过部分机会。
需调整参数组合找到最优参数对,最大程度发掘策略潜力。
对应的解决方法:
利用 walk-forward analysis 方法找到最优参数。
增加参数优化模块,实时优化参数。
调整两种指标的组合逻辑,综合考虑。
五、策略优化方向
增加参数自适应优化模块,使参数能根据市场环境实时调整
增加机器学习模型,辅助判断指标信号的准确性
扩展更多指标,组成指标集,利用投票机制产生 Entry 信号
利用深度学习模型替代传统指标,以数据驱动方法判断 Entry 和 Exit 时机
六、总结
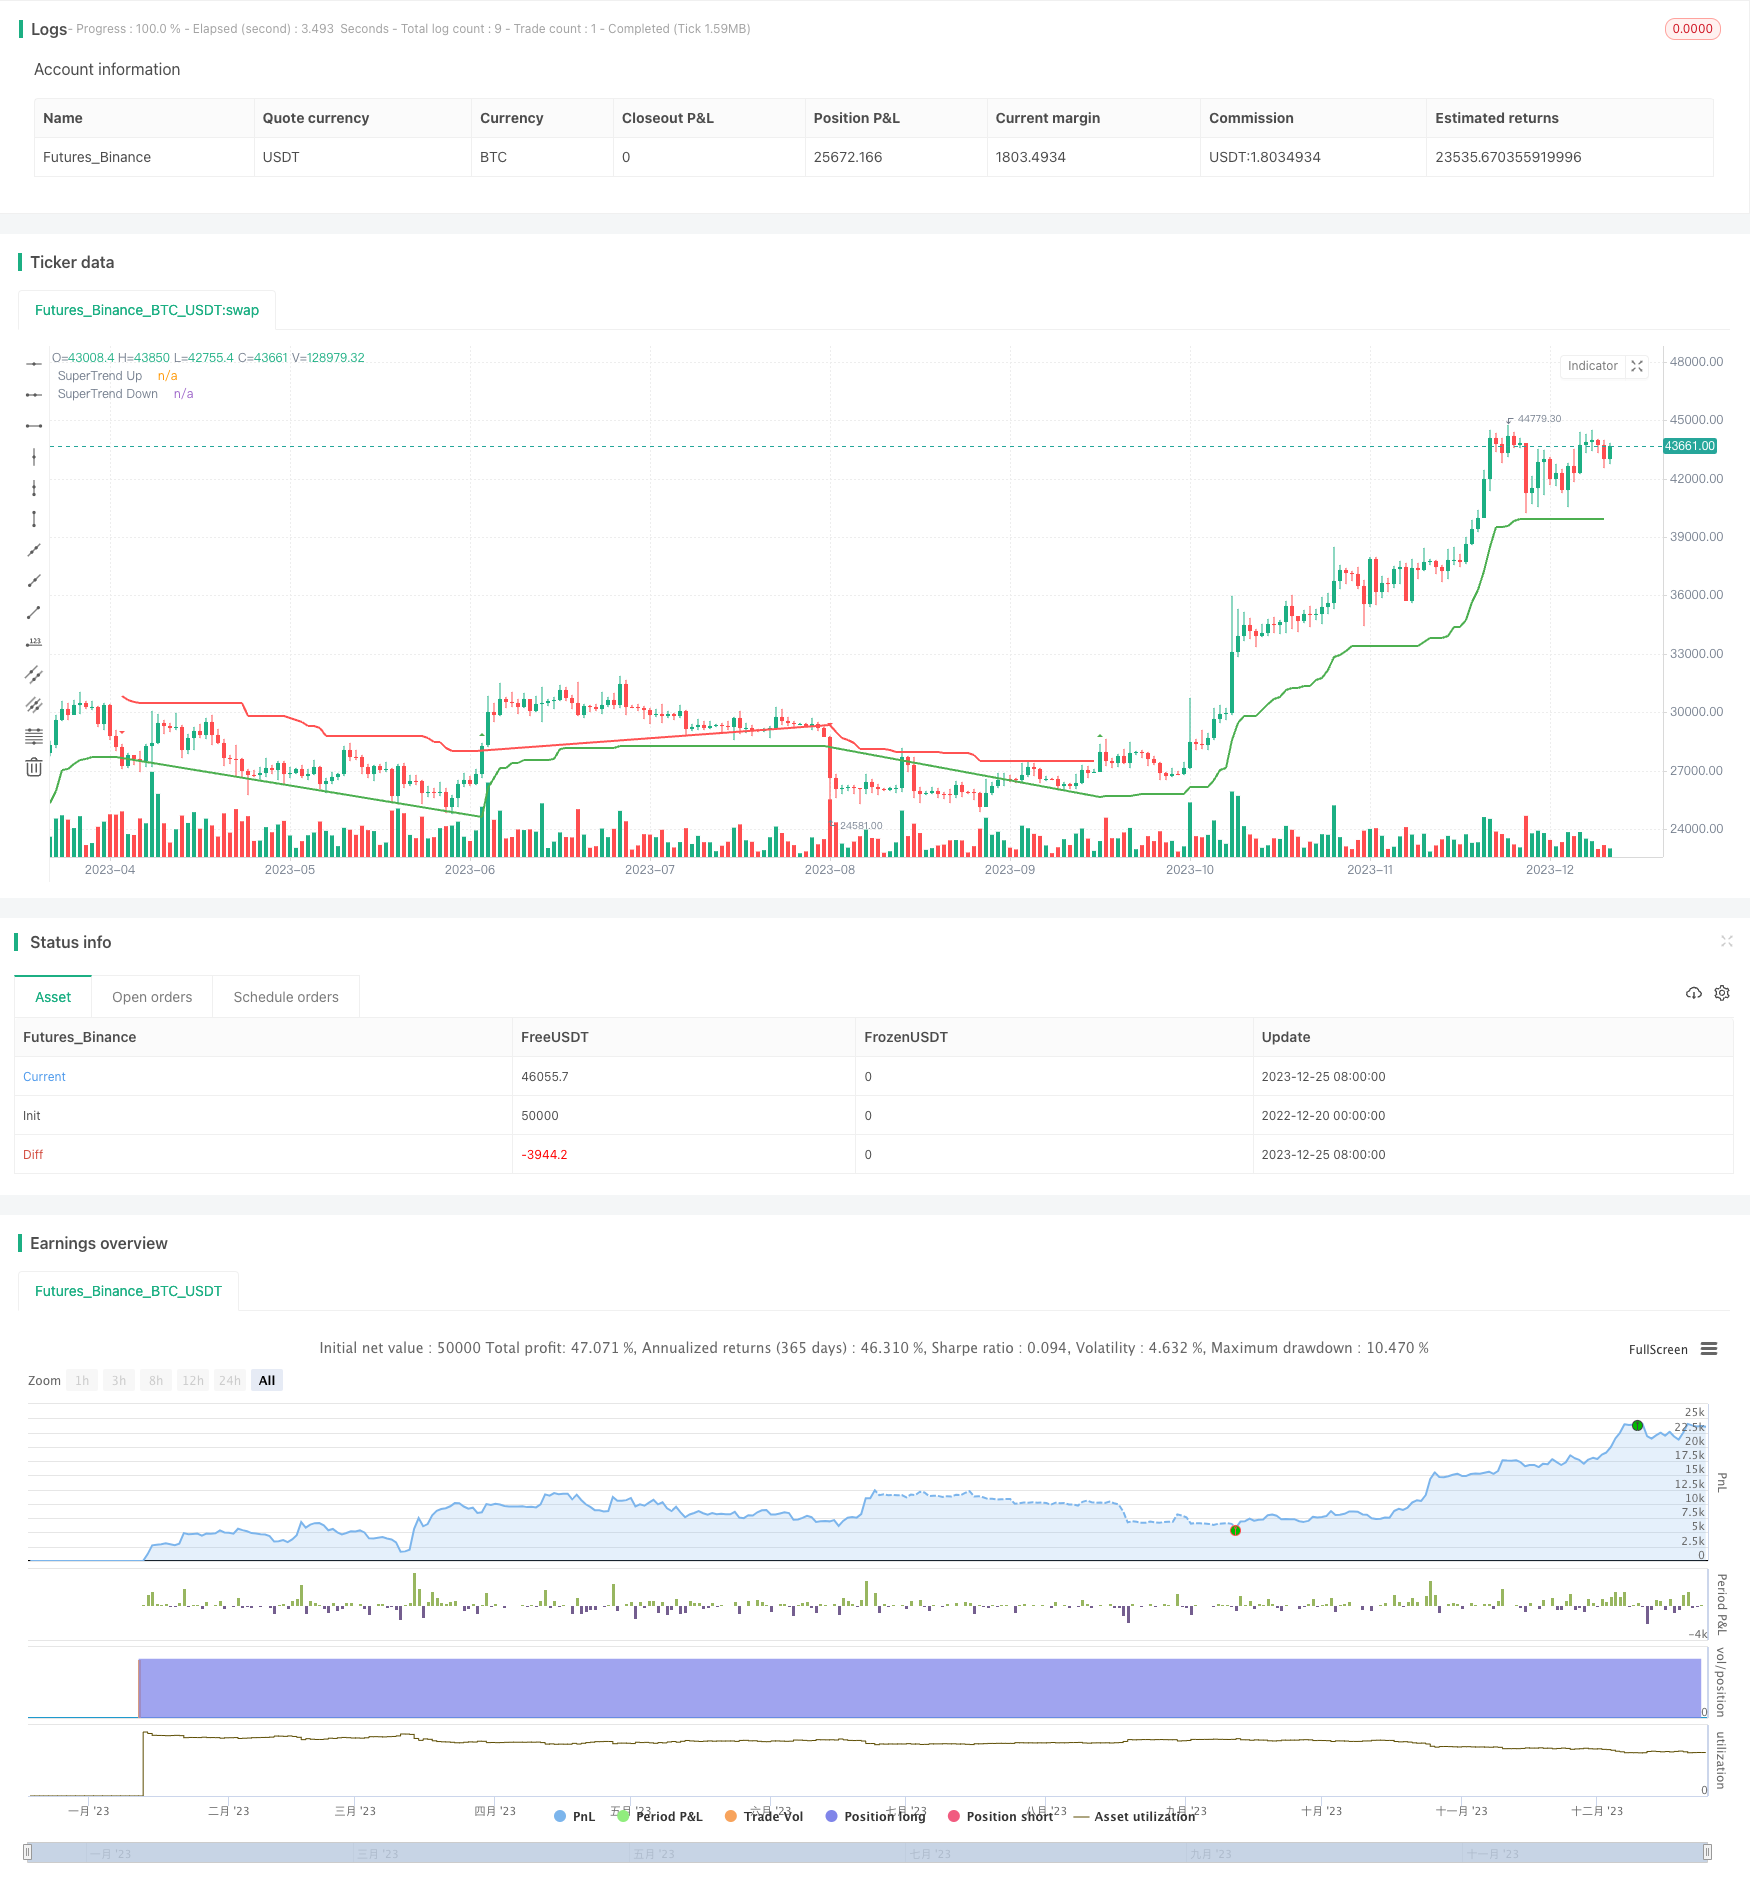
本策略综合运用动量指标和 SuperTrend 指标的优势,通过双重验证提高 Entry 准确性,并利用指标判断 Exit 时机。相比单一使用指标,能够减少假信号,获取更高胜率。通过参数优化、机器学习等技术扩展,策略效果还有进一步提升空间,值得深入研究与应用。
/*backtest
start: 2022-12-20 00:00:00
end: 2023-12-26 00:00:00
period: 1d
basePeriod: 1h
exchanges: [{"eid":"Futures_Binance","currency":"BTC_USDT"}]
*/

//@version=4
strategy("Momentum + SuperTrend Strategy", overlay=true)

// Momentum Strategy
length = input(12)
price = close
momentum(seria, length) =>
    mom = seria - seria[length]
    mom
mom0 = momentum(price, length)
mom1 = momentum(mom0, 1)
momLongCondition = mom0 > 0 and mom1 > 0
momShortCondition = mom0 < 0 and mom1 < 0

// SuperTrend Strategy
Periods = input(10)
Multiplier = input(3.0)
changeATR = input(true)
src = input(hl2)
atr2 = sma(tr, Periods)
atr = changeATR ? atr(Periods) : atr2
up = src - (Multiplier * atr)
up1 = nz(up[1], up)
up := close[1] > up1 ? max(up, up1) : up
dn = src + (Multiplier * atr)
dn1 = nz(dn[1], dn)
dn := close[1] < dn1 ? min(dn, dn1) : dn
trend = 1
trend := nz(trend[1], trend)
trend := trend == -1 and close > dn1 ? 1 : trend == 1 and close < up1 ? -1 : trend
buySignal = trend == 1 and trend[1] == -1
sellSignal = trend == -1 and trend[1] == 1

// Combined Entry Conditions
longCondition = momLongCondition and buySignal
shortCondition = momShortCondition and sellSignal

// Strategy Entries
if (longCondition)
    strategy.entry("MomLE", strategy.long, stop=high+syminfo.mintick, comment="MomLE")
else
    strategy.cancel("MomLE")

if (shortCondition)
    strategy.entry("MomSE", strategy.short, stop=low-syminfo.mintick, comment="MomSE")
else
    strategy.cancel("MomSE")

// Plot SuperTrend on the chart
upPlot = plot(trend == 1 ? up : na, title="SuperTrend Up", color=color.green, linewidth=2)
dnPlot = plot(trend == -1 ? dn : na, title="SuperTrend Down", color=color.red, linewidth=2)

// Highlight the SuperTrend region
fill(upPlot, dnPlot, color = trend == 1 ? color.new(color.green, 90) : color.new(color.red, 90), title="SuperTrend Highlight")

// Plot SuperTrend Buy/Sell signals on the chart
plotshape(series=buySignal, title="SuperTrend Buy Signal", color=color.green, style=shape.triangleup, size=size.small)
plotshape(series=sellSignal, title="SuperTrend Sell Signal", color=color.red, style=shape.triangledown, size=size.small)
// This Pine Script™ code is subject to the terms of the Mozilla Public License 2.0 at https://mozilla.org/MPL/2.0/
// © naveen1119