概述
本文主要描述了一种结合相对强弱指数(RSI)与斐波那契回转位进行交易的策略。该策略首先根据一定周期内的历史价格动态计算出关键的斐波那契回转位,然后结合RSI指标判断市场是否超买超卖,在回转位附近发出交易信号。
策略原理
该策略主要基于以下原理:
使用一定周期(如200根K线)的价格数据,计算出该周期的价格中值、标准差和关键斐波那契回转位(如0.764);
当价格接近上方或下方回转位时,借助RSI指标判断该回转位区域是否存在超买超卖现象;
如果RSI指标显示超买或超卖信号,则在回转位附近发出做多或做空信号;
并设置止损和止盈水平,在超过设置价格或触发止损条件时平仓。
以上就是该策略判断交易时机的基本流程。
策略优势分析
相比单一使用RSI或斐波那契进行交易,该组合策略具有以下优势:
双重指标过滤,可以减少假信号,提高信号质量;
回转位附近进行反转交易,是比较经典的技术分析手法;
设置止损止盈后,可以有效控制单笔交易的最大损失;
可通过参数优化,调整指标参数和回转位设置,适应不同周期和品种。
策略风险分析
该策略也存在一定的风险需要注意:
关键回转位靠近后再反弹的概率并不是100%,需要结合价格实体判断;
单一周期RSI可能产生垂死反弹的假信号,可以考虑多周期验证;
停损点设置过于宽松,可能增加亏损;
标的价格剧烈波动时,止损可能被突破,需要考虑放宽止损点。
以上风险都可通过参数调整、优化指标结合等方法加以控制。
策略优化方向
该策略还可进一步优化的地方包括:
增加成交量指标的验证,避免低量的假突破;
考虑布林带指标,在带状突破时发出信号;
构建机器学习或神经网络模型,自动识别高质量交易机会;
利用遗传算法等方法自动优化参数,调整止损止盈点。
总结
本文详细阐述了一种结合RSI和斐波那契回转位进行判断的量化交易策略。该策略集双重指标分析与经典技术策略于一体,在控制风险的前提下,提高交易信号的质量。随着参数调整与模型优化的进行,策略效果还可获得进一步提升。
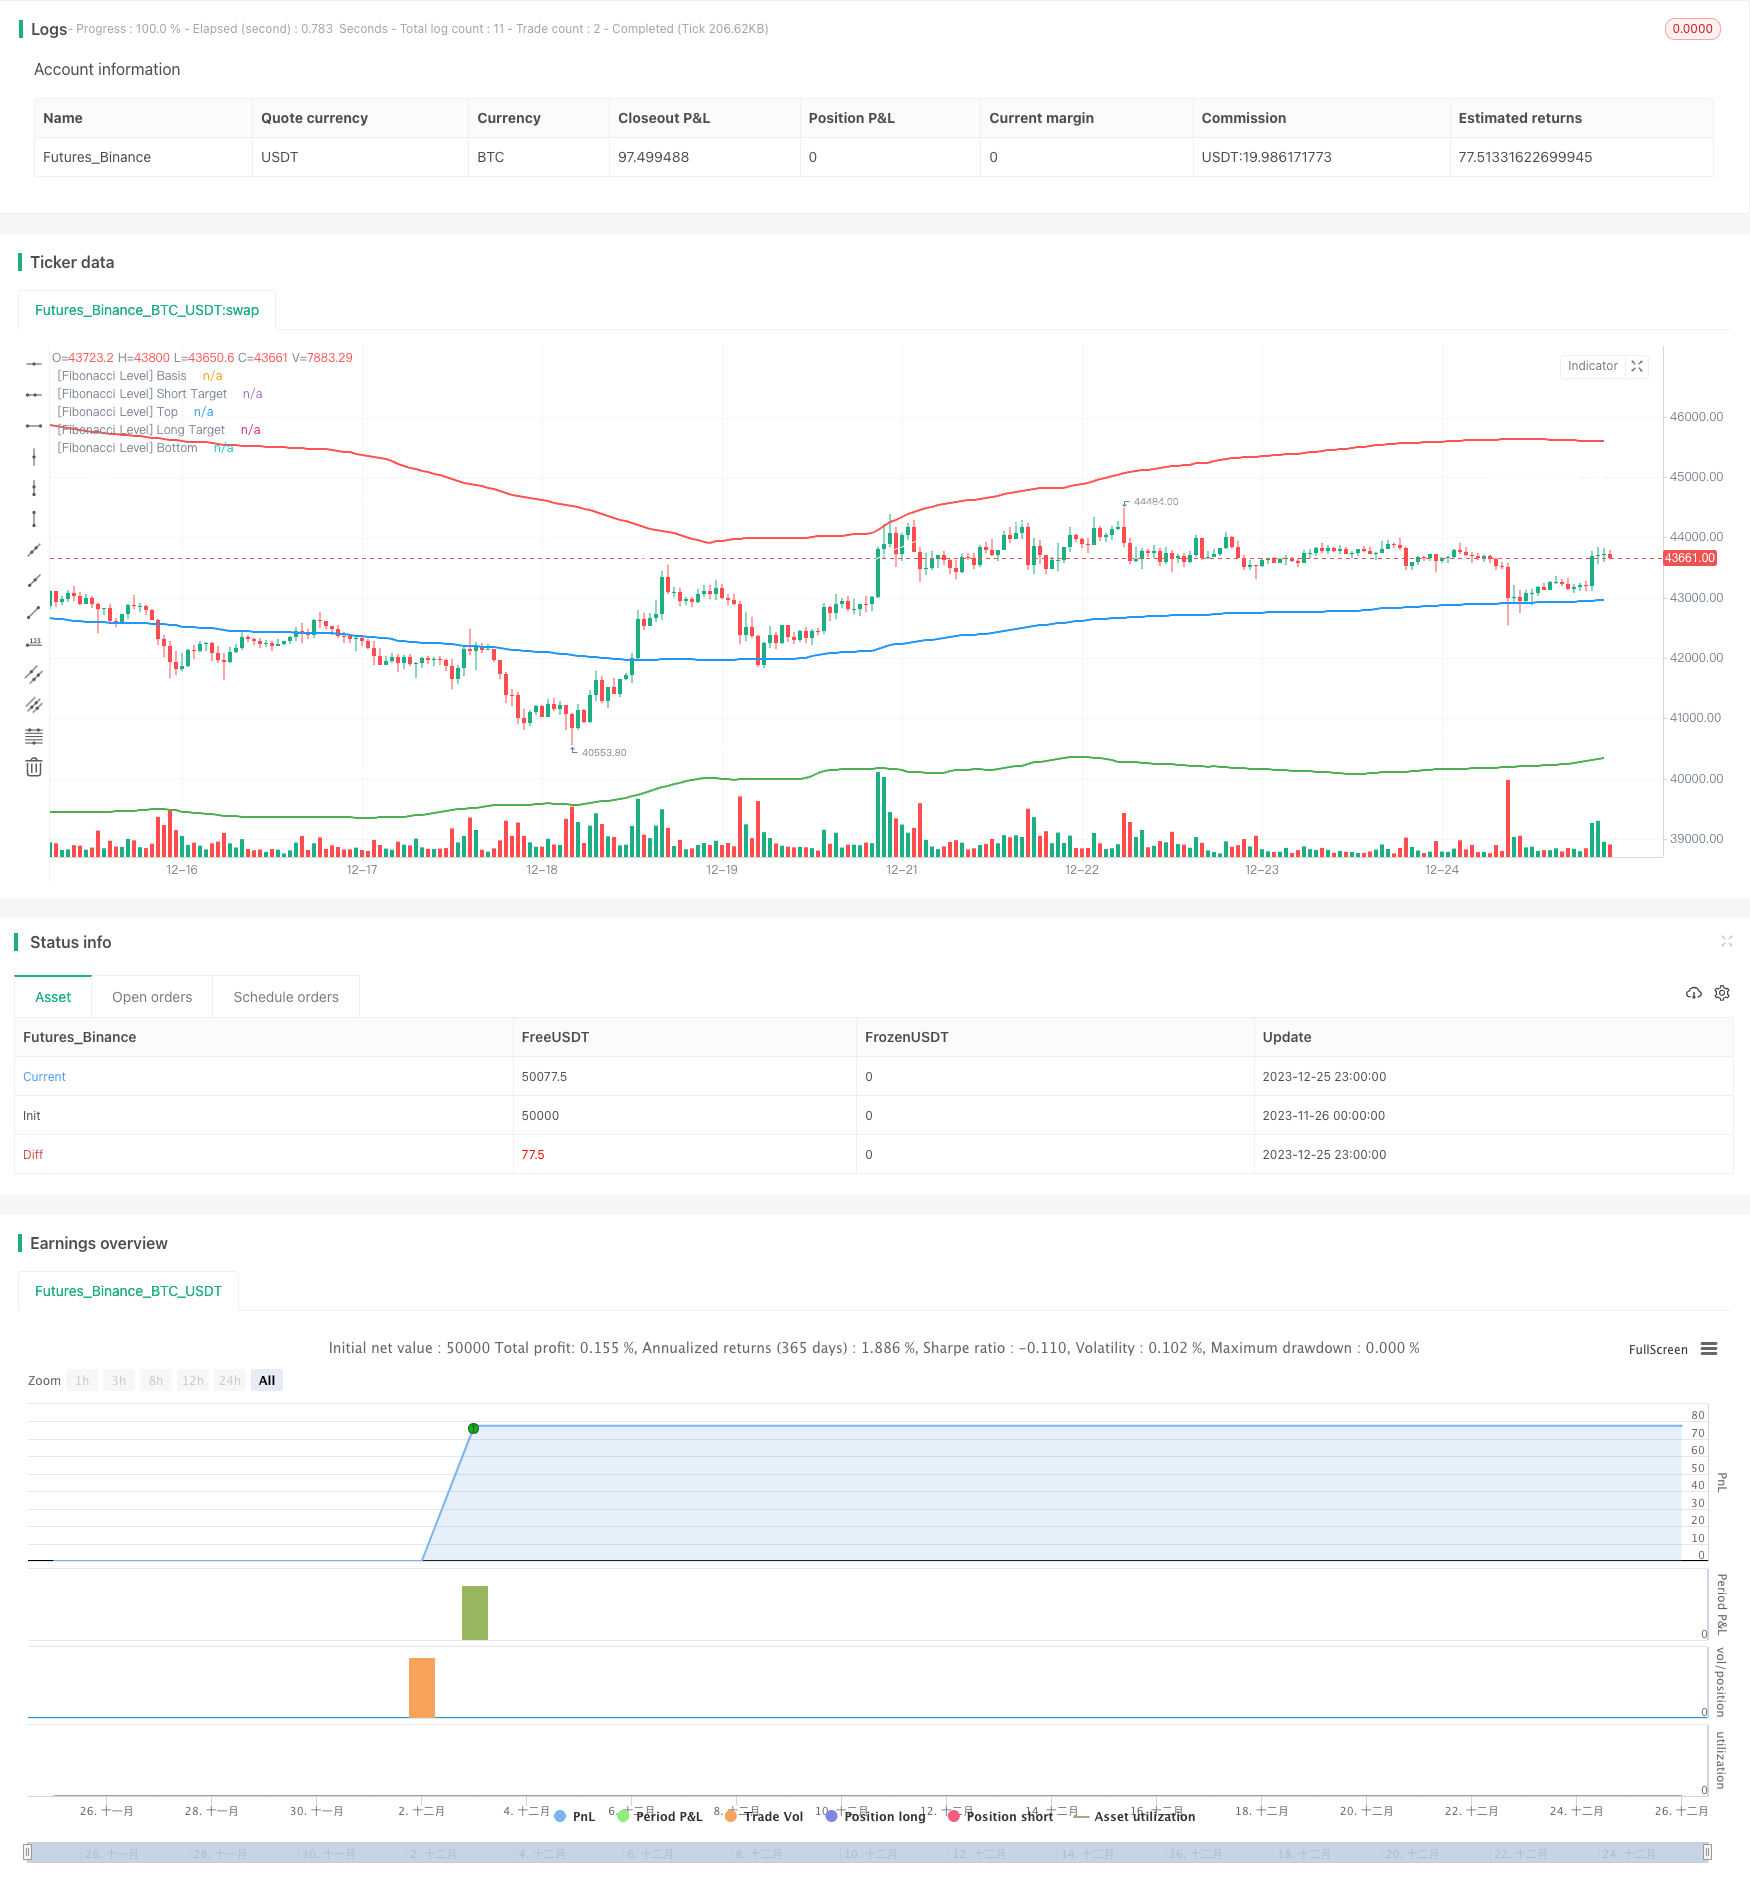
/*backtest
start: 2023-11-26 00:00:00
end: 2023-12-26 00:00:00
period: 1h
basePeriod: 15m
exchanges: [{"eid":"Futures_Binance","currency":"BTC_USDT"}]
*/

//@version=4
strategy(title="Gab Fib  + RSI", overlay=true, default_qty_type=strategy.cash, default_qty_value=100000, initial_capital=1000, currency=currency.USD, commission_type=strategy.commission.cash_per_order, commission_value=4)

// Inputs
timeFilter = year >= 2000
    // Stop Loss
stop_loss = input(title="SL in % of Instrum. i.e 1.5%=150pips", minval=0, step=0.1, defval=1.5) /100
    // RSI Inputs
len = input(title="[RSI] Length", minval=0, step=1, defval=14)
overSold = input(title="[RSI] Over Sold %", defval=30)
overBought = input(title="[RSI] Over Bought %", defval=70)
    // Fibonacci Levels
length = input(title="[Fibonacci] Length", defval=200, minval=1)
src = input(hlc3, title="[Fibonacci] Source")
mult = input(title="[Fibonacci] Multiplier", defval=3.0, minval=0.001, maxval=50)
level = input(title="[Fibonacci] Level", defval=764)


// Calculate Fibonacci
basis = vwma(src, length)
dev = mult * stdev(src, length)
fu764= basis + (0.001*level*dev)
fu1= basis + (1*dev)
fd764= basis - (0.001*level*dev)
fd1= basis - (1*dev)

// Calculate RSI
vrsi = rsi(close, len)

// Calculate the Targets
targetUp = fd764
targetDown = fu764
    // Actual Targets
bought = strategy.position_size[0] > strategy.position_size[1]
exit_long = valuewhen(bought, targetUp, 0)
sold = strategy.position_size[0] < strategy.position_size[1]
exit_short = valuewhen(sold, targetDown, 0)

// Calculate Stop Losses
sl_long = close * (1-stop_loss)
sl_short = close * (1+stop_loss)


// Conditions to Open Trades
openLong = low < fd1 and crossover(vrsi[1], overSold)
openShort = high > fu1 and crossunder(vrsi[1], overBought)

// Conditions to Close Trades
closeLong = high > exit_long or sl_long
closeShort = low < exit_short or sl_short


//Rounding to MinTick value
roundtargetUp = round_to_mintick(targetUp)
roundtargetDown = round_to_mintick(targetDown)
roundsllong = round_to_mintick(sl_long)
roundslshort = round_to_mintick(sl_short)

// Plots
plot(basis, color=color.blue, linewidth=2, title="[Fibonacci Level] Basis")
plot(fu764, color=color.white, linewidth=1, title="[Fibonacci Level] Short Target")
plot(fu1, color=color.red, linewidth=2, title="[Fibonacci Level] Top")
plot(fd764, color=color.white, linewidth=1, title="[Fibonacci Level] Long Target")
plot(fd1, color=color.green, linewidth=2, title="[Fibonacci Level] Bottom")


// Strategy Orders
if timeFilter
    // Entry Orders
    strategy.entry(id="buy", long=true, when=openLong and high < targetUp, limit=close, alert_message="buy,"+tostring(syminfo.ticker)+",tp="+tostring(roundtargetUp)+",sl="+tostring(roundsllong))
    strategy.entry(id="sell", long=false, when=openShort and low > targetDown, limit=close,  alert_message="sell,"+tostring(syminfo.ticker)+",tp="+tostring(roundtargetDown)+",sl="+tostring(roundslshort))

    // Exit Orders
    strategy.exit(id="closelong", when=closeLong and strategy.position_size > 0, limit=exit_long, stop=sl_long, alert_message="closelong,"+tostring(syminfo.ticker))
    strategy.exit(id="closeshort", when=closeShort and strategy.position_size < 0, limit=exit_short, stop=sl_short, alert_message="closeshort,"+tostring(syminfo.ticker))