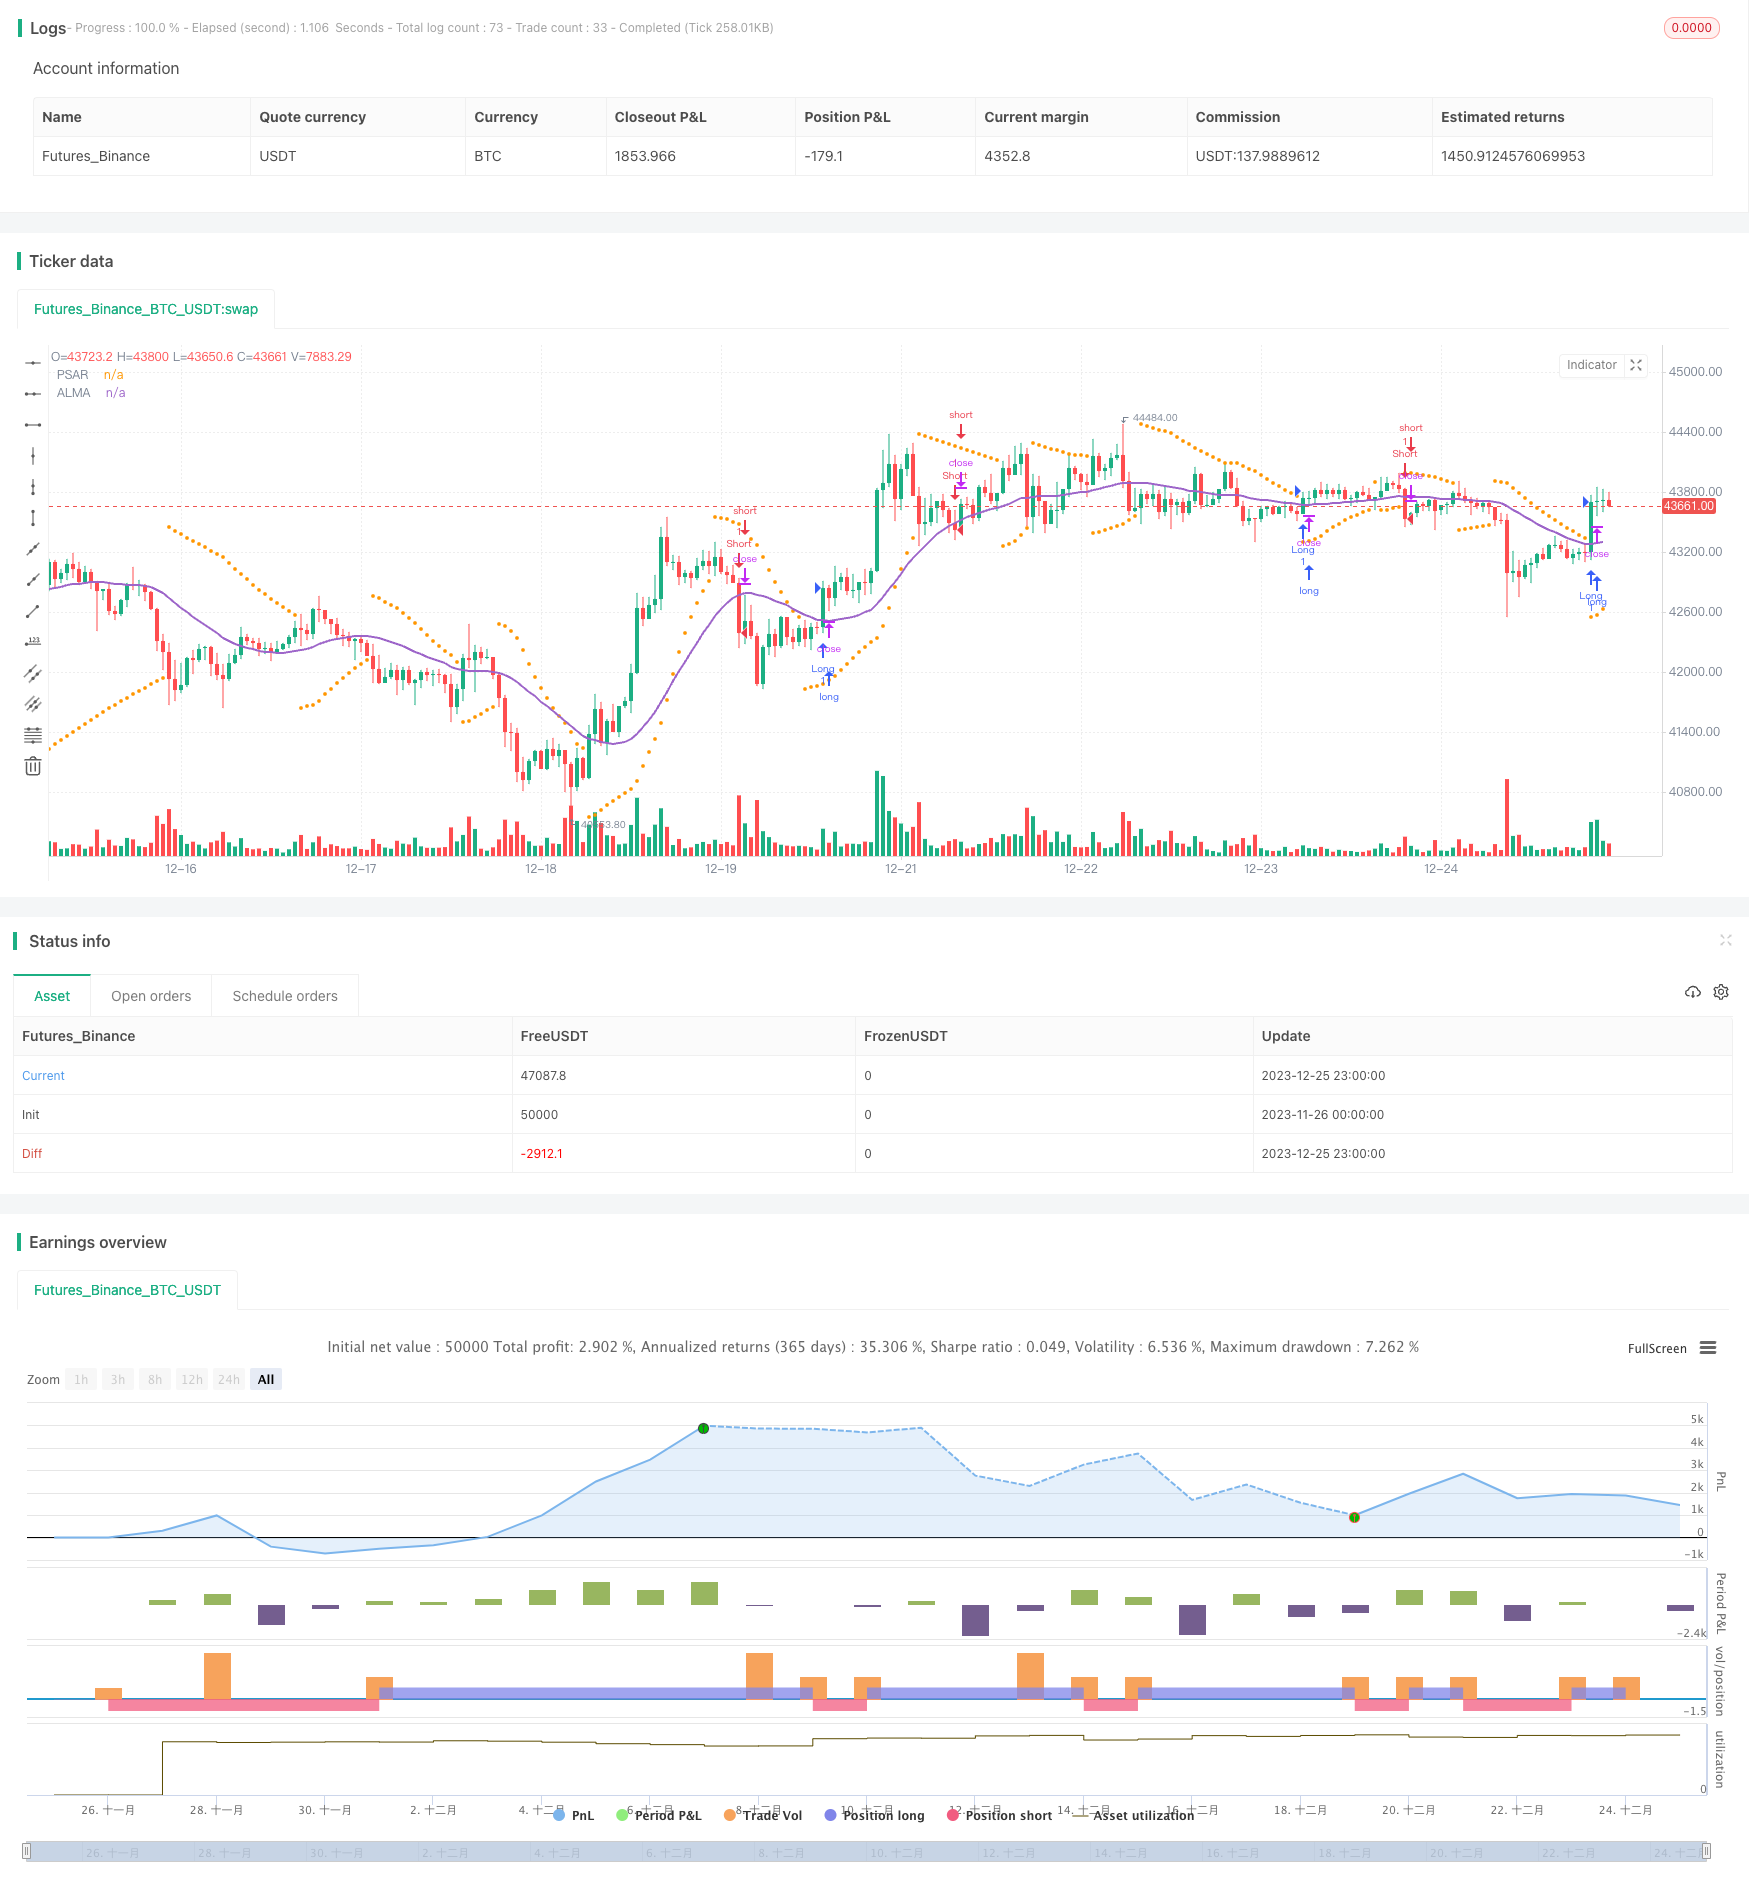
Double Moving Average Crossover Strategy

Author: ChaoZhang, Date: 2023-12-27 17:45:43
Tags:

img

Overview

This strategy adopts the Bollinger Bands indicator and moving average to determine trading signals. The Arnoud Legoux indicator is used to calculate the moving average, combined with the Parabolic SAR indicator to judge the entry signals. The strategy name is “Double Moving Average Crossover Strategy”, containing both the moving average indicator and the double line condition judgment characteristics.

Principles

The core logic of this strategy is to judge the relationship between the Bollinger Bands and the moving average indicator. It uses the Bollinger Bands with a certain width of moving average bands to determine the long and short signals when the moving average line crossovers.

Specifically, the strategy combines the Arnoud Legoux moving average indicator and the Parabolic SAR indicator.

The Arnoud Legoux moving average indicator is an improved version based on the traditional moving average. Compared with the ordinary moving average, it introduces the Offset displacement to adjust the angle of the moving average line more flexibly. At the same time, the Sigma value is used to adjust the smoothness of the moving average line.

The Parabolic SAR indicator is a very common stop-loss indicator. It can give very clear reversal signals to track the price trend. When the Parabolic SAR indicator is below the price, it represents a bullish state. On the contrary, above the price is a bearish state.

The logic for judging the indicator relationship is as follows:

  1. Judge whether the close is greater than the open within the day
  2. Judge if the Parabolic SAR is lower than the lowest price: a bullish signal
  3. Judge if the close breaks through the Arnoud Legoux moving average line: it also represents a bullish signal
  4. When all the above 3 conditions are met at the same time, a buy signal is generated for long position

The logic for judging the short signal is the opposite:

  1. Judge whether the close is lower than the open within the day
  2. Judge if the Parabolic SAR is higher than the highest price: a bearish signal
  3. Judge if the close breaks the Arnoud Legoux moving average line: it also represents a bearish signal
  4. When all the above 3 conditions are met at the same time, a sell signal is generated for short position

Advantages

This strategy combines the Bollinger Bands indicator and the moving average indicator to take into account both trend judgment and breakout trading. The main advantages are:

  1. The moving average indicator can effectively determine the price trend
  2. The Parabolic SAR indicator can accurately determine price reversal points
  3. The Arnoud Legoux moving average has high flexibility and its shape can be adjusted through parameters
  4. The combination of double indicator judgment avoids the probability of misjudgment of a single indicator
  5. Intraday Yin and Yang further avoid unnecessary trading

Risks

There are also some risks in this strategy:

  1. Inappropriate parameter settings may lead to too high or too low trading frequency
  2. Mismatching parameters when combining double indicators can also affect strategy performance
  3. Moving average strategies are less adaptable to volatile markets
  4. The strategy does not consider capital management factors and may face overleverage risks

The corresponding solutions are:

  1. Parameter optimization to make a better match between indicators
  2. Optimize capital management strategies to control single position size
  3. Introduce more indicator filters to reduce mis-trading possibilities

Optimization Directions

There are many directions for optimizing this strategy:

  1. Introduce machine learning models in development for automatic parameter optimization
  2. Implement advanced capital management strategies like fixed ratio ordering and drawdown control
  3. Incorporate more auxiliary indicators to build a composite trading system to improve system stability
  4. Optimize the drawdown control strategy by introducing stop loss methods to avoid expanding losses
  5. Building algo trading systems, connecting faster market data and order execution channels

Summary

This strategy uses the double judgment of Bollinger Bands and moving average indicators. There is a large space for optimization in terms of parameter tuning and strategy combination. By introducing more quantitative methods, the strategy can be further optimized into a stable profit-generating algorithmic trading strategy.


/*backtest
start: 2023-11-26 00:00:00
end: 2023-12-26 00:00:00
period: 1h
basePeriod: 15m
exchanges: [{"eid":"Futures_Binance","currency":"BTC_USDT"}]
*/

//@version=3
//Author: HighProfit

//Lead-In
strategy("Parabolic SAR & Arnoud Legoux Moving Avarage Strategy", shorttitle="ST-PSAR+ALMA", overlay=true)

//Arnoud Legoux Moving Avarage Inputs
source = close
windowsize = input(title="Window Size",defval=50)
offset = input(title="Offset", type=float, defval=0.85)
sigma = input(title="Sigma", type=float, defval=6)

//Parabolic SAR Inputs
start = input(title="Start", type=float, defval=0.02)
increase = input(title="Increase", type=float, defval=0.02)
max = input(title="Max", type=float, defval=.2)

//Conditions
longCondition = close>open and sar(start, increase, max) < low and crossover(close, alma(source, windowsize, offset, sigma))
if (longCondition)
    strategy.entry("Long", strategy.long)

shortCondition = close<open and sar(start, increase, max) > high and crossunder(close, alma(source, windowsize, offset, sigma))
if (shortCondition)
    strategy.entry("Short", strategy.short)

//Plots   
plot(alma(source, windowsize, offset, sigma), linewidth=2, title="ALMA")
plot(sar(start, increase, max), style=circles, linewidth=2, title="PSAR")

More