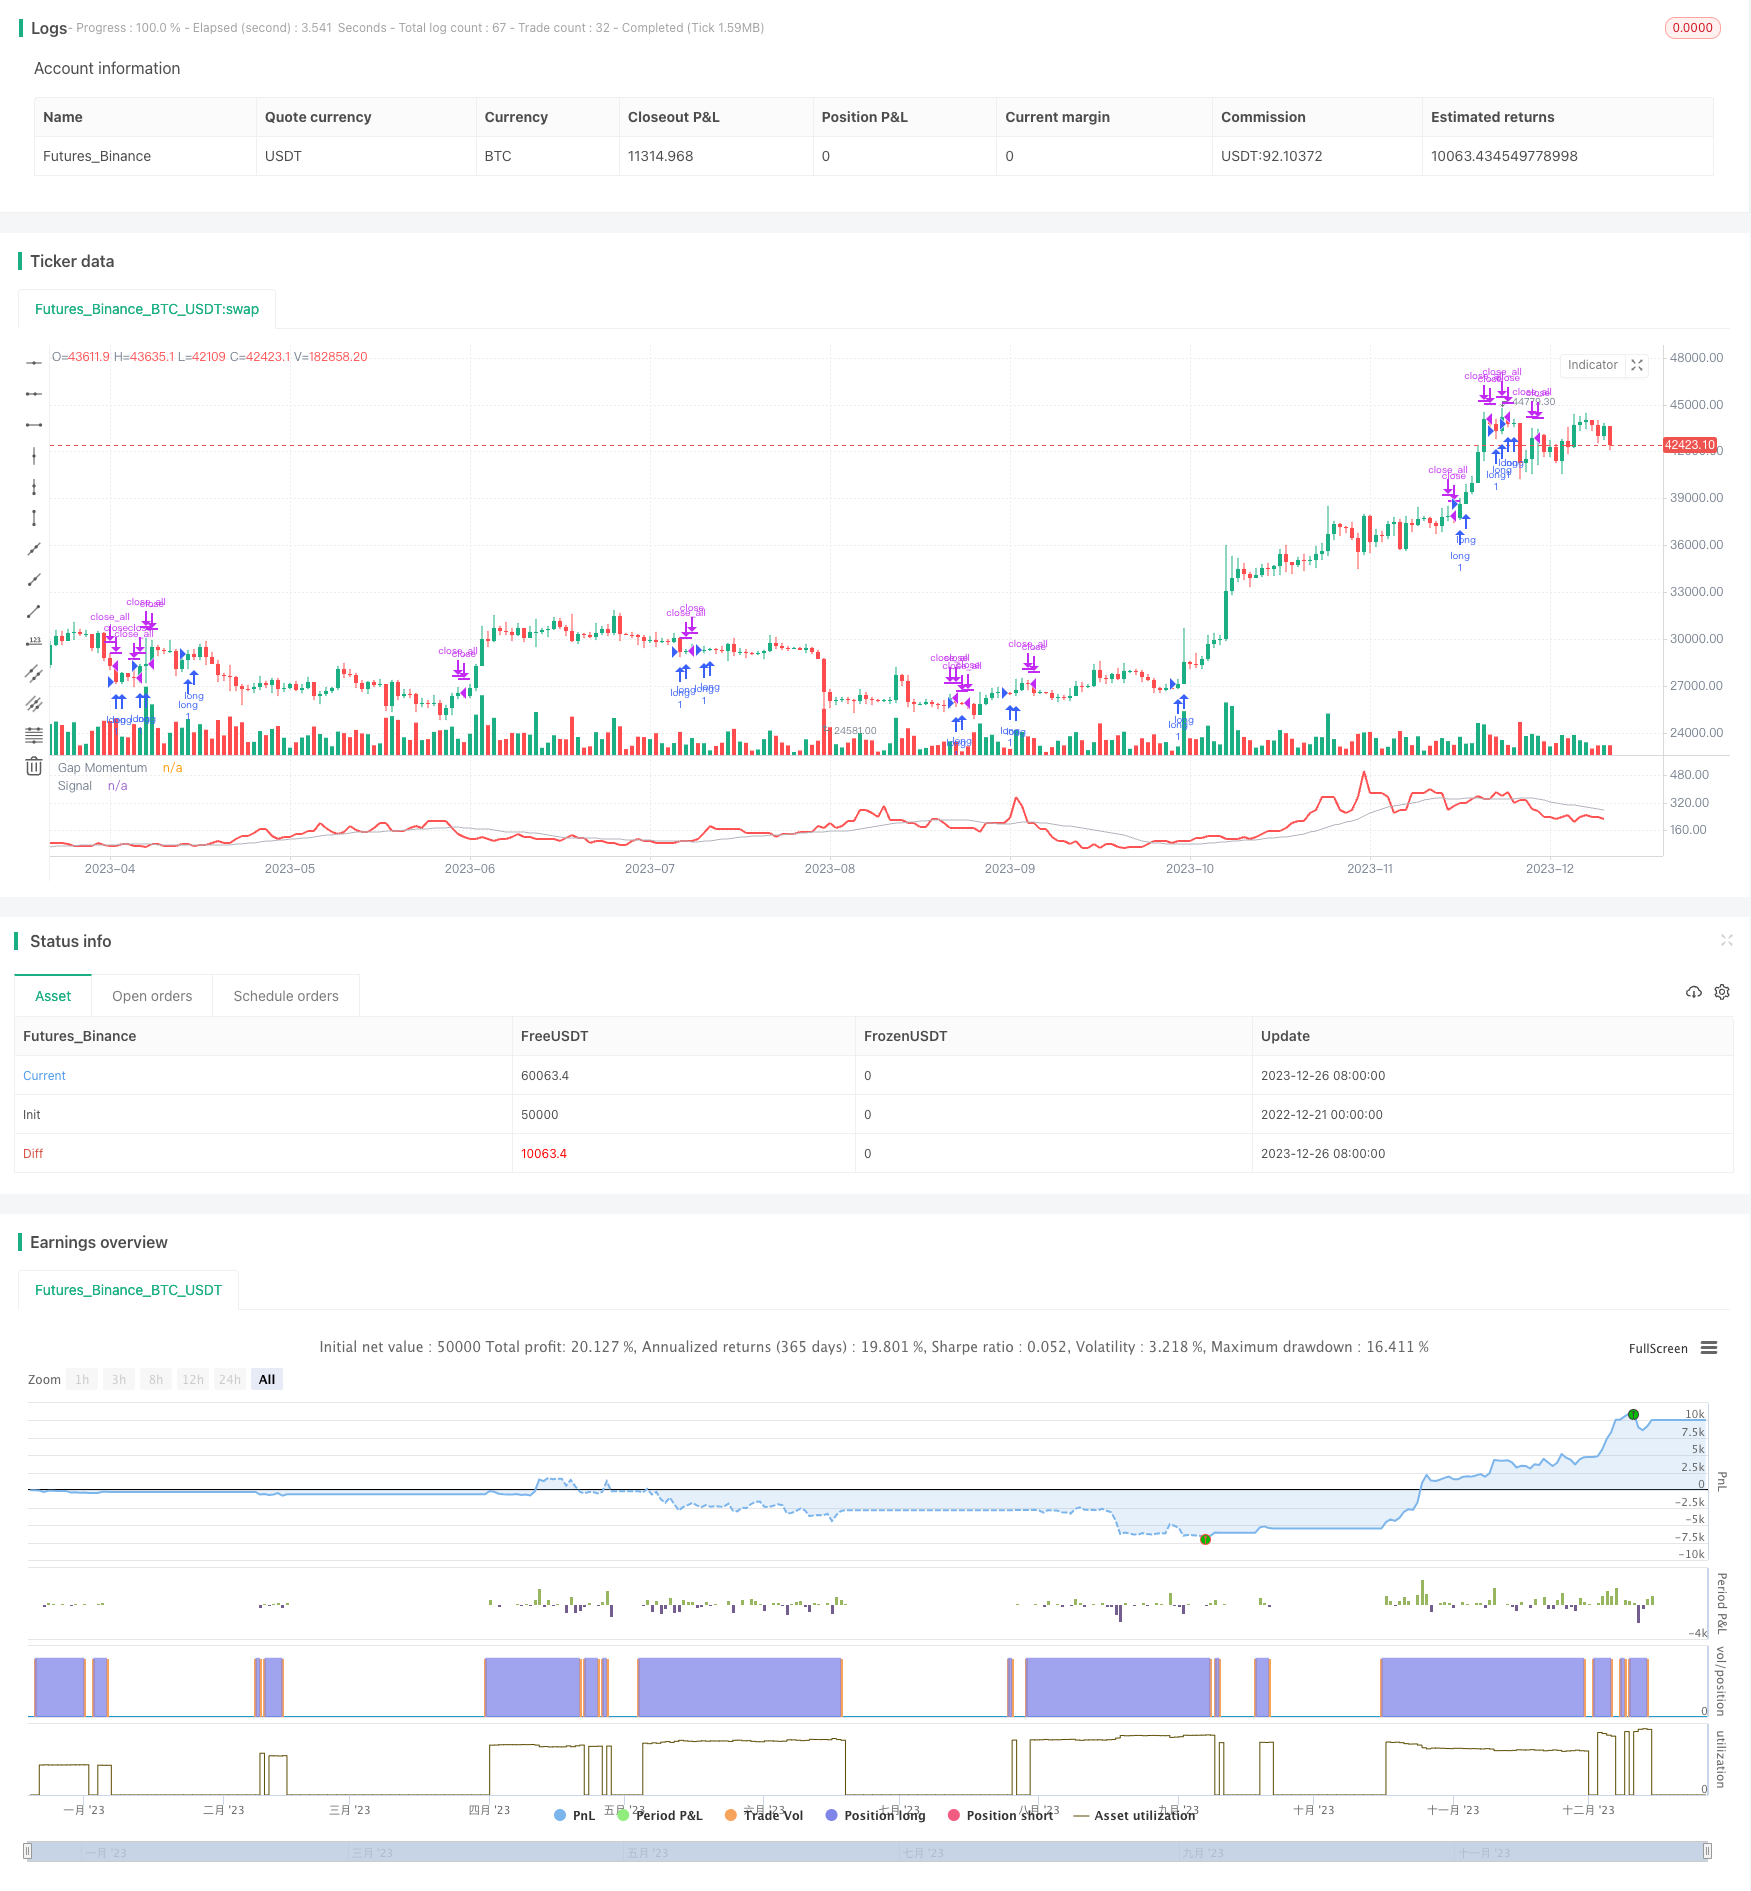
The Momentum Gap Trading Strategy is a quantitative trading strategy that tracks price fluctuations. It utilizes the gap between the opening price and the previous day’s closing price (called the gap) to construct a momentum indicator and generates trading signals with it. The strategy is suitable for high volatility stocks and can capture price continuations after gap openings.
This strategy is based on an article titled “Gap Momentum Indicator” published by Perry J. Kaufman, former quantitative analyst at Boeing, in the January 2024 issue of Technical Analysis magazine. Kaufman constructed a momentum time series tracking gaps and proposed using the moving average of that time series as trading signals. A long position is opened when the momentum indicator crosses above its moving average, and flattened when it crosses below.
The key to the Momentum Gap strategy lies in constructing the gap momentum time series. The construction logic is similar to the quantitative term “On-Balance Volume (OBV)”, except that the price input is changed from the daily close to the daily gap.
The specific calculation process is:
Calculate the ratio of the sum of positive gaps over the past N days to the sum of negative gaps (absolute values) over the same period.
Add the resulting ratio to the cumulative time series called Gap Momentum.
Apply a moving average to the Gap Momentum sequence to generate signals.
A positive gap is defined as the difference when the opening price is higher than the previous day’s closing price, and negative gap vice versa. The ratio essentially reflects the recent strength contrast between positive and negative gaps.
The moving average smoothes the original volatile sequence and can be used to issue trading signals. This strategy employs a slower moving average, establishing long positions when the fast Gap Momentum indicator crosses above it and flattening positions when crossing below it.
Compared with traditional technical indicators, the Momentum Gap Trading Strategy has the following strengths:
Captures market imbalances with price gaps
Gaps represent huge supply and demand imbalances. Tracking gaps compares market strength and effectively captures such imbalances.
Persistence
Price gaps are often followed by trend continuations. Tracking gap momentum captures price swings. The indicator design enhances this persistence.
Simple to implement
The whole indicator only contains two parameters, a window for tracking momentum and a period for smoothing signals. Extremely easy to implement.
Quantifiable rules suitable for automation
Adopting quantifiable trading rules with high standardization, it can be directly connected to auto-trading systems for algorithmic trading.
Despite many strengths, the Momentum Gap Trading Strategy also carries some risks:
Prone to false signals
Gaps may fill shortly after opening, causing the indicator to generate incorrect signals.
Ineffective in choppy markets
Frequent price whipsaws can lead to excessive offsetting signals.
Potential overfitting
Very easy to overfit with just two parameters.
It is advisable to manage risks by:
Adopting stops to limit losses
Increasing parameters to adapt more market states
Ensemble optimization to avoid overfitting
This strategy can be expanded and enhanced in the following dimensions:
Combining multiple time frames
Adopting Gap Momentum indicators tracking different momentum windows can achieve complementary effects across time frames.
Incorporating gap metrics
For instance, combining true gap size with ATR as risk management.
Considering more gap characteristics
Such as gap distance, frequency, opening days etc.
Machine learning models
Training more complex ML models on gap data may achieve better performance.
The Momentum Gap Trading Strategy is a simple yet practical breakout strategy. By tracking price gaps, an important market microstructure change, it uncovers the drastic supply and demand shifts hidden behind. Compared to other technical indicators, it reflects market imbalances more clearly and swiftly seizes price trend turning points. That said, risk controls are still necessary to address potential issues. This strategy exemplifies how identifying opportunities based on market structure can lead to effective techniques that can be further optimized and innovated in practice.
/*backtest start: 2022-12-21 00:00:00 end: 2023-12-27 00:00:00 period: 1d basePeriod: 1h exchanges: [{"eid":"Futures_Binance","currency":"BTC_USDT"}] */ // TASC Issue: January 2024 - Vol. 42, Issue 1 // Article: Gap Momentum Indicator // Taking A Page From The On-Balance Volume // Article By: Perry J. Kaufman // Language: TradingView's Pine Script™ v5 // Provided By: PineCoders, for tradingview.com //@version=5 string title = 'TASC 2024.01 Gap Momentum System' string stitle = 'GMS' strategy(title, stitle, false) int period = input.int( 40, 'Period:') int signalPeriod = input.int( 20, 'Signal Period:') bool longOnly = input.bool(true, 'Long Only:') float gap = open - close[1] float gapUp = 0.0 float gapDn = 0.0 switch gap > 0 => gapUp += gap gap < 0 => gapDn -= gap float gapsUp = math.sum(gapUp, period) float gapsDn = math.sum(gapDn, period) float gapRatio = gapsDn == 0?1.0:100.0*gapsUp/gapsDn float signal = ta.sma(gapRatio, signalPeriod) if strategy.opentrades <= 0 and signal > signal[1] // buy at next open: strategy.entry('long', strategy.long) else if strategy.opentrades > 0 and signal < signal[1] if longOnly // close all at next open: strategy.close_all() else // sell at next open: strategy.entry('short', strategy.short) plot(gapRatio, 'Gap Momentum', color.red, 2) plot(signal, 'Signal', color.silver, 1)template: strategy.tpl:40:21: executing "strategy.tpl" at <.api.GetStrategyListByName>: wrong number of args for GetStrategyListByName: want 7 got 6