概述
均线反弹吸筹策略是一种同时结合技术指标和价格形态,在支撑阻力位进行做多做空操盘的策略。该策略使用均线指标识别市场趋势方向,使用基于价格极值的形态指标辅助确定反转点,结合前期高点低点判断关键的支撑和阻力位置,在这些位进行反向操作,属于典型的意义反转策略。
策略原理
该策略主要通过以下几个步骤判断操作时机:
使用三均线Alligator指标判断趋势方向。当价格线突破该指标的Lip Lines时,认为出现了较强的突破信号。
使用Peak-Trough模式指标识别价格在超买超卖区域反转的时机。突破Peak-Trough某一方向的极值点时,判断为可能的反转信号。
结合支撑和阻力位判断反转操作的具体入场点。在价格接近前期的支撑或阻力位时开仓做多做空。
使用EMA均线指标辅助判断长期趋势方向。例如在震荡行情中,短期操作以跳空反转为主,在趋势行情中则以顺势操作为主。
采用移动止损方式,控制单笔损失。
策略优势
该策略具有以下几个优势:
同时结合多种指标信号,提高判断的准确性。
利用关键支撑阻力进行反转,是高概率操作。
采用移动止损方式,可以限制单笔亏损。
策略风险
该策略也存在以下风险:
多指标组合判断,操作频率可能较高,需要关注交易成本控制。
关键位失败是最大风险,如果价格没有在预想的支持或阻力位附近反转,那么亏损可能会比较大。
在行情剧烈波动时,移动止损可能会被突破,导致亏损扩大。
策略优化方向
该策略可以从以下几个方面进行优化:
对多指标权重进行优化调整,找到最佳参数组合。
增加机器学习算法,辅助判断关键位的成功率。
加入交易量指标,避免在价格剧烈波动但成交量不足时被套。
优化移动止损模型,在保证止损有效性的同时,尽量减少无谓止损的概率。
总结
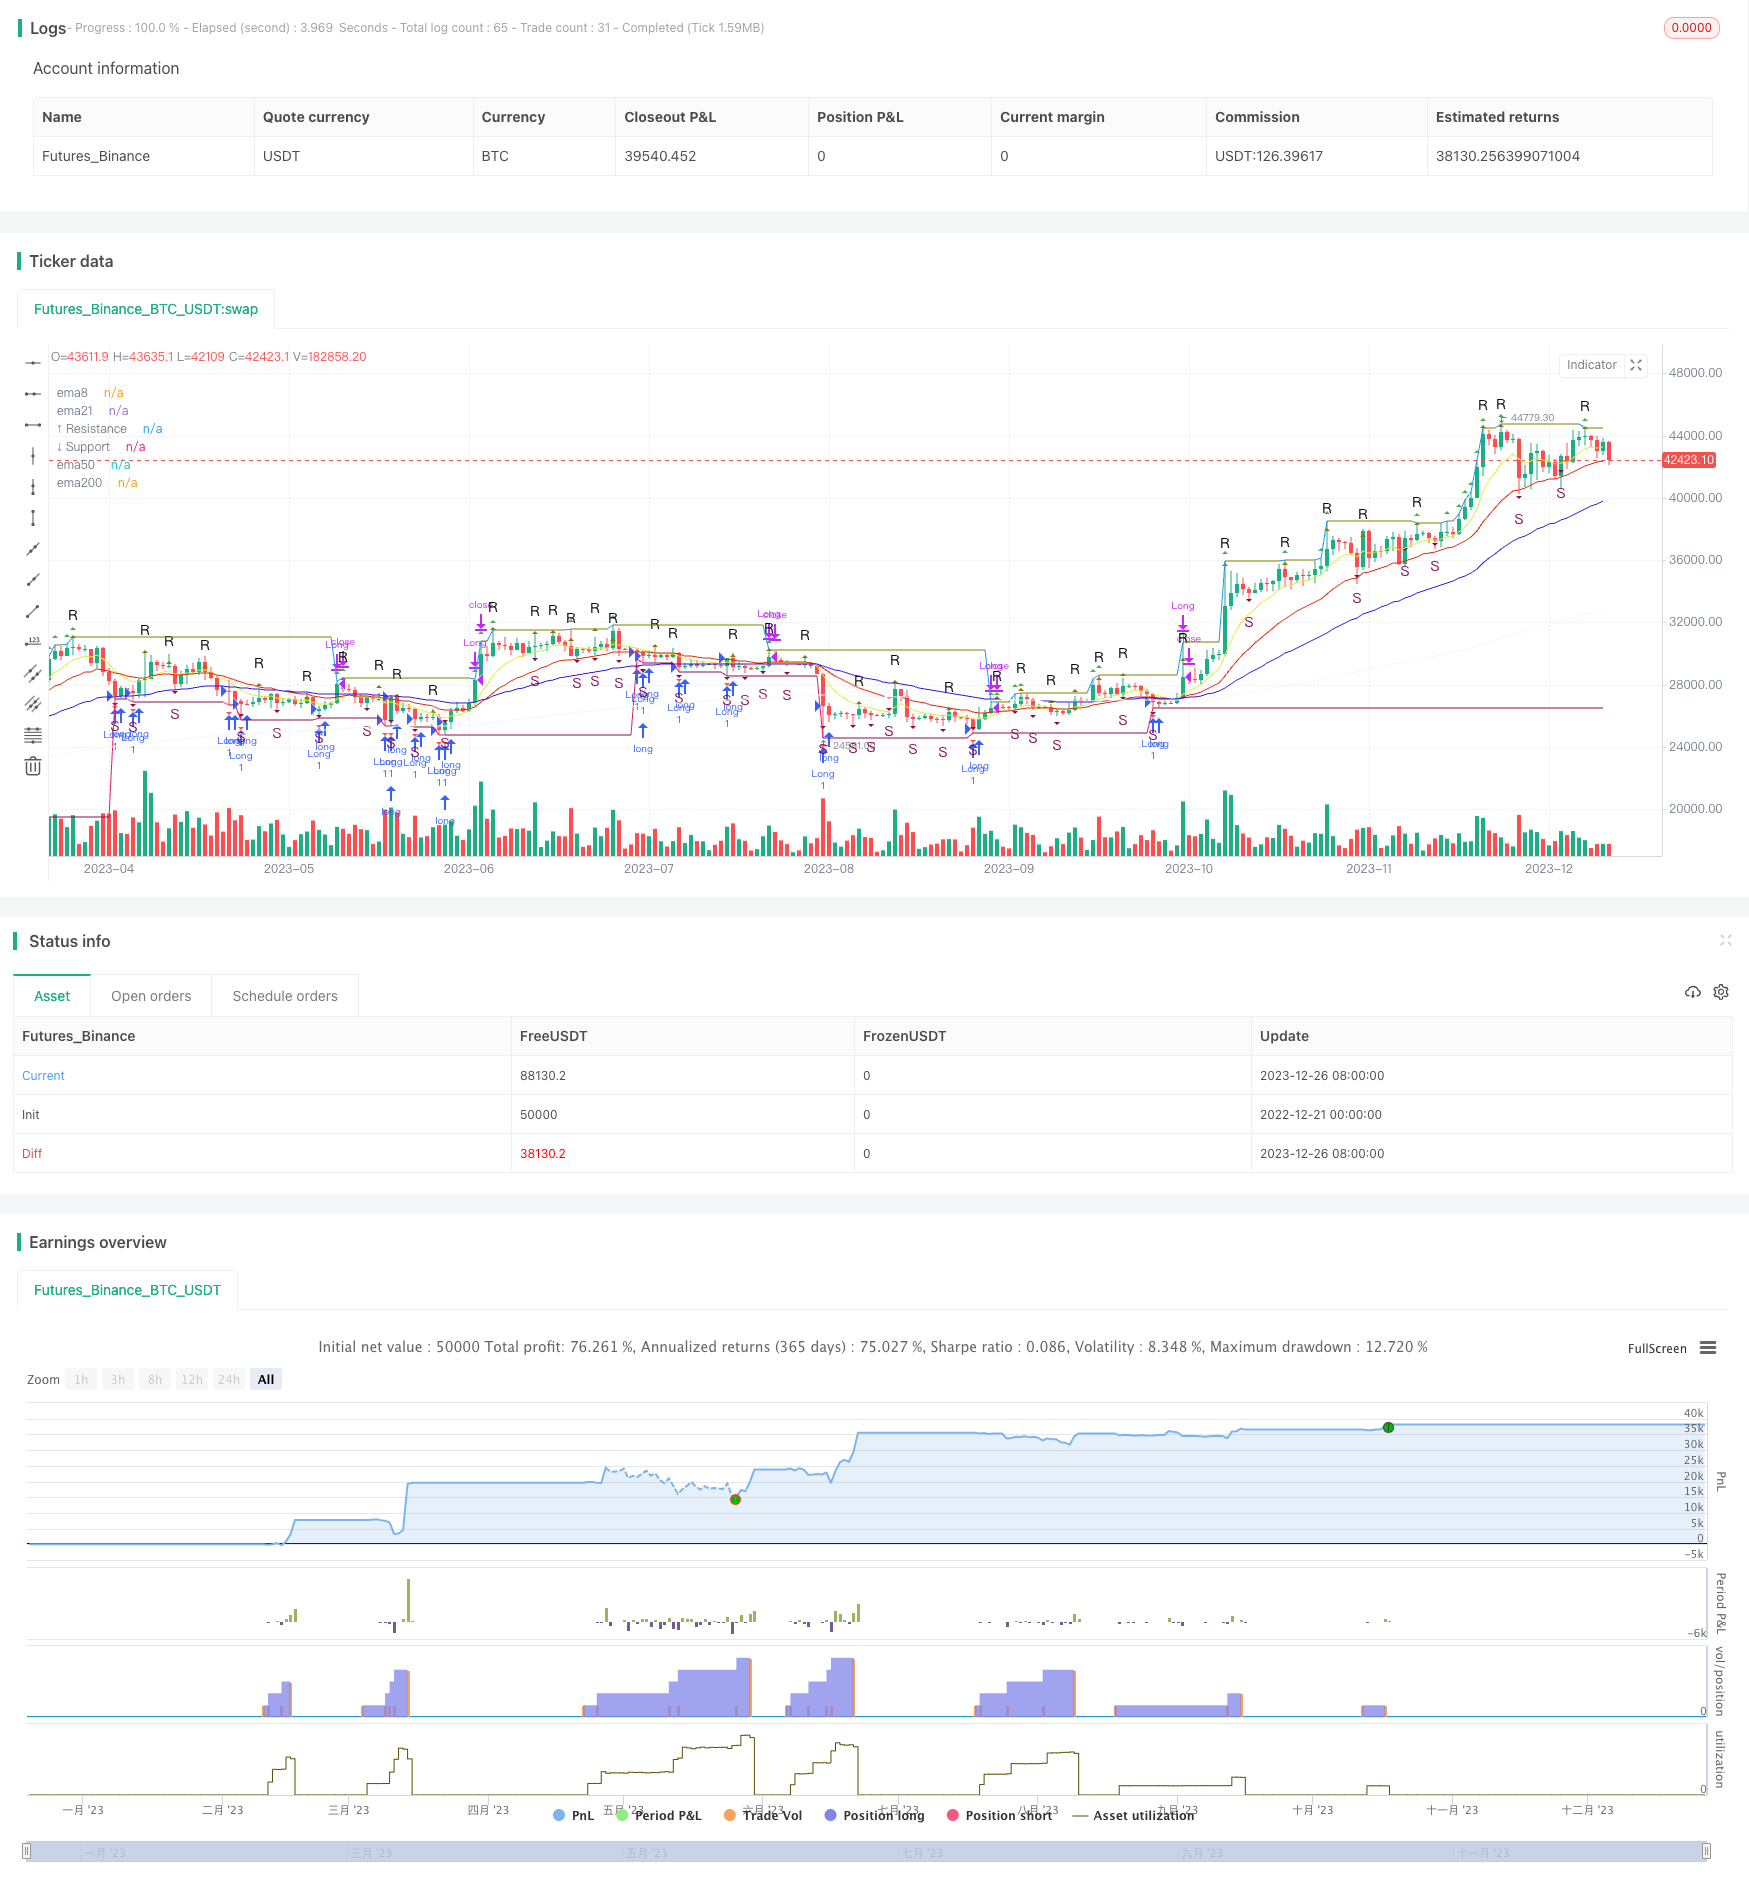
综上所述,该均线反弹吸筹策略同时利用均线、价格形态、支撑阻力位等多重指标进行判断,是一种典型的技术策略。它具有判断准确度较高,高概率操作的优势,但也需要注意关键位失败和移动止损被突破的风险。通过持续优化多指标权重、应用机器学习和成交量指标等手段,可以在一定程度上提升策略的效果。
/*backtest
start: 2022-12-21 00:00:00
end: 2023-12-27 00:00:00
period: 1d
basePeriod: 1h
exchanges: [{"eid":"Futures_Binance","currency":"BTC_USDT"}]
*/

// This source code is subject to the terms of the Mozilla Public License 2.0 at https://mozilla.org/MPL/2.0/
// © vhurtadocos


//@version=5
strategy('Estrategia EMA Resistencia Soporte', shorttitle='Estrategia EMA RESISTENCIA Y SOPORTE', overlay=true, margin_long=100, margin_short=100, pyramiding = 10 )

//INICIO DE CONDICIONES BASICAS
/// Alligator
smma(src, length) =>
    smma = 0.0
    sma_1 = ta.sma(src, length)
    smma := na(smma[1]) ? sma_1 : (smma[1] * (length - 1) + src) / length
    smma
lipsLength = input(title='🐲 Lips Length', defval=5)
teethLength = input(title='🐲 Teeth Length', defval=8)
jawLength = input(title='🐲 Jaw Length', defval=13)
lipsOffset = input(title='🐲 Lips Offset', defval=3)
teethOffset = input(title='🐲 Teeth Offset', defval=5)
jawOffset = input(title='🐲 Jaw Offset', defval=8)
lips = smma(hl2, lipsLength)
teeth = smma(hl2, teethLength)
jaw = smma(hl2, jawLength)


// Fractals
n = input.int(title='📌 Period', defval=2, minval=2)
upFractal = high[n + 2] < high[n] and high[n + 1] < high[n] and high[n - 1] < high[n] and high[n - 2] < high[n] or high[n + 3] < high[n] and high[n + 2] < high[n] and high[n + 1] == high[n] and high[n - 1] < high[n] and high[n - 2] < high[n] or high[n + 4] < high[n] and high[n + 3] < high[n] and high[n + 2] == high[n] and high[n + 1] <= high[n] and high[n - 1] < high[n] and high[n - 2] < high[n] or high[n + 5] < high[n] and high[n + 4] < high[n] and high[n + 3] == high[n] and high[n + 2] == high[n] and high[n + 1] <= high[n] and high[n - 1] < high[n] and high[n - 2] < high[n] or high[n + 6] < high[n] and high[n + 5] < high[n] and high[n + 4] == high[n] and high[n + 3] <= high[n] and high[n + 2] == high[n] and high[n + 1] <= high[n] and high[n - 1] < high[n] and high[n - 2] < high[n]
dnFractal = low[n + 2] > low[n] and low[n + 1] > low[n] and low[n - 1] > low[n] and low[n - 2] > low[n] or low[n + 3] > low[n] and low[n + 2] > low[n] and low[n + 1] == low[n] and low[n - 1] > low[n] and low[n - 2] > low[n] or low[n + 4] > low[n] and low[n + 3] > low[n] and low[n + 2] == low[n] and low[n + 1] >= low[n] and low[n - 1] > low[n] and low[n - 2] > low[n] or low[n + 5] > low[n] and low[n + 4] > low[n] and low[n + 3] == low[n] and low[n + 2] == low[n] and low[n + 1] >= low[n] and low[n - 1] > low[n] and low[n - 2] > low[n] or low[n + 6] > low[n] and low[n + 5] > low[n] and low[n + 4] == low[n] and low[n + 3] >= low[n] and low[n + 2] == low[n] and low[n + 1] >= low[n] and low[n - 1] > low[n] and low[n - 2] > low[n]
plotshape(title='📌 Up-Fractal', series=upFractal, style=shape.triangleup, location=location.abovebar, offset=-2, color=color.new(color.olive, 0), text="R")
plotshape(title='📌 Down-Fractal', series=dnFractal, style=shape.triangledown, location=location.belowbar, offset=-2, color=color.new(color.maroon, 0), text="S", textcolor = color.new(color.maroon,0))

// Resistance, Support
showRS = input(title='⤒⤓ Show Res-Sup', defval=true)
lengthRS = input(title='⤒⤓ Res-Sup Length', defval=13)
highRS = ta.valuewhen(high >= ta.highest(high, lengthRS), high, 0)
lowRS = ta.valuewhen(low <= ta.lowest(low, lengthRS), low, 0)
plot(title='⤒ Resistance', series=showRS and highRS ? highRS : na, color=highRS != highRS[1] ? na : color.olive, linewidth=1, offset=0)
plot(title='⤓ Support', series=showRS and lowRS ? lowRS : na, color=lowRS != lowRS[1] ? na : color.maroon, linewidth=1, offset=0)


// EMA de 8 períodos
ema8 = ta.ema(close, 8)
plot(title='ema8', series=ema8, color=color.new(#dbef41, 0), offset=0)

// EMA de 21 períodos
ema21 = ta.ema(close, 21)
plot(title='ema21', series=ema21, color=color.new(#e12c0c, 0), offset=0)

// EMA de 50 períodos
ema50 = ta.ema(close, 50)
plot(title='ema50', series=ema50, color=color.new(#3419de, 0), offset=0)

// EMA de 200 períodos
ema200 = ta.ema(close, 200)
plot(title='ema200', series=ema200, color=color.new(#f6f6f4, 0), offset=0)


// Definiciones originales...
// ... (incluyendo tus definiciones de Alligator, Fractals, etc.)

// Guardamos el último soporte y resistencia
var float lastSupport = na
var float lastResistance = na

// Detectando un nuevo soporte y resistencia
newSupportDetected = low == lowRS


if newSupportDetected
    lastSupport := low

// Lógica de entrada y salida

// Condiciones de entrada basadas en soportes recién formados
longCondition = low == lowRS
if longCondition
    strategy.entry("Long", strategy.long)

// Salida (take profit) cuando detectamos una nueva resistencia después de entrar en una posición long
newResistanceDetected = high == highRS
if newResistanceDetected and strategy.position_size > 0
    strategy.close("Long")

// Agregar una condición para el stop loss
longStopLossPrice = close * 0.95
if strategy.position_size > 0 and close <= longStopLossPrice
    strategy.close("Long")

// Pintamos los soportes y resistencias
plotshape(longCondition, style=shape.triangledown, location=location.belowbar, color=color.red)
plotshape(newResistanceDetected, style=shape.triangleup, location=location.abovebar, color=color.green)

// Resto del código para plotear las EMAs y fractales
// ...