概述
超级趋势反转策略是一种结合超级趋势指标和RSI指标的反转交易策略。该策略利用超级趋势判断市场趋势方向,再结合RSI指标识别反转机会,在趋势反转点进行交易。
策略原理
超级趋势反转策略主要由两部分组成:
超级趋势指标判断市场趋势
超级趋势指标通过计算当前价格与一定周期的平均真实波幅的价格带来判断趋势方向。当价格突破上轨时为看涨,而价格跌破下轨时为看跌。
RSI指标识别反转
RSI指标通过比较一段时间内的收盘涨价日数和跌价日数,来判断当前是否处于超买超卖状态。结合超级趋势指标,可以发现趋势反转的时机。
本策略中,通过一定transformations,得到处理后的RSI曲线,设定阈值线,RSI曲线突破相应阈值时产生买入和卖出信号。
优势分析
超级趋势反转策略结合趋势和反转指标,综合考量趋势力量和超买超卖现象,可以在相对较好的位置打开和平仓,从而获得较优的策略收益。
主要优势有:
- 结合趋势和反转,在反转点交易
- 回撤可控,较好控制风险
- 参数优化空间大,可根据市场调整
风险分析
超级趋势反转策略也存在一定的风险,主要包括:
反转失败风险
反转信号可能是假信号,不能成功反转,此时亏损可能加大。
参数优化风险
不当的参数优化可能导致策略过拟合,无法适应市场的变化。
技术指标滞后
所有技术指标都存在滞后,可能错过最佳进入位置。
针对这些风险,可以通过组合其他指标,调整参数优化方法等方式进一步优化和改进。
优化方向
超级趋势反转策略可根据市场和需求,在以下维度进行优化:
- 优化超级趋势参数,适应不同市场
- 优化或改进RSI反转触发逻辑
- 增加止损策略,以控制单笔亏损
- 结合其他指标,确定反转可靠性
- 加入交易量指标,避免假突破
总结
超级趋势反转策略融合趋势交易和反转交易的优点,既可以顺势而为,又可以在反转点打开仓位。通过不断测试和优化参数,适当地控制风险,该策略可以获得稳定的策略收益。其可优化空间也非常大,可根据市场实际情况调整。
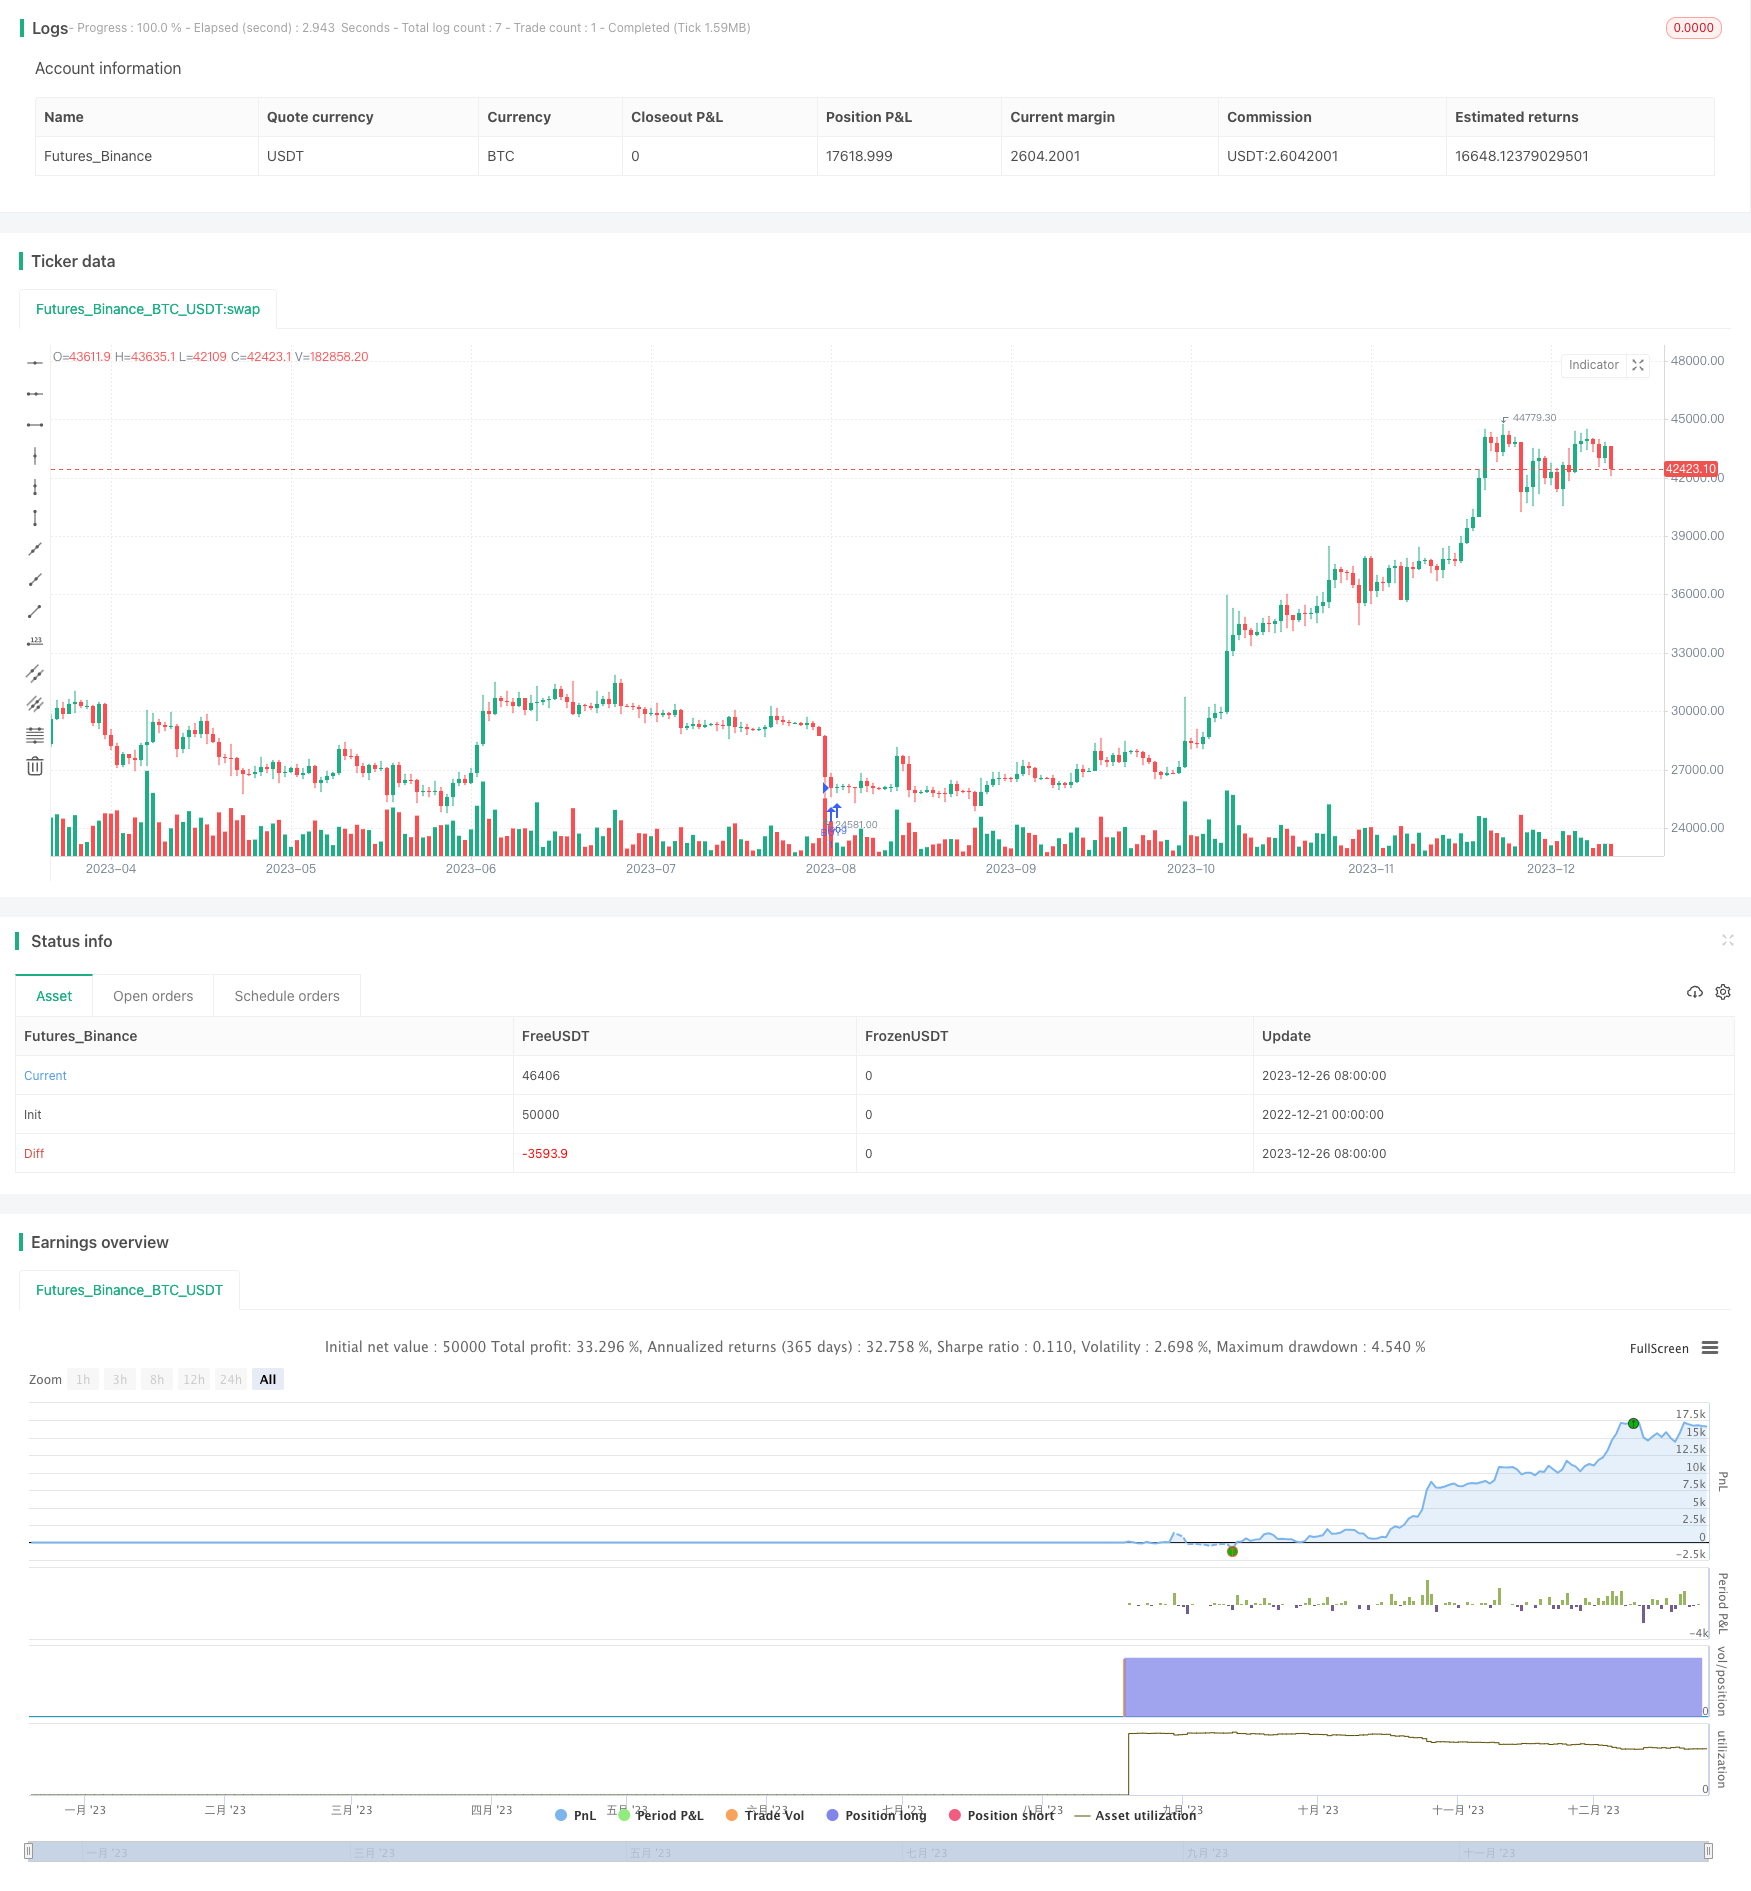
策略源码
/*backtest
start: 2022-12-21 00:00:00
end: 2023-12-27 00:00:00
period: 1d
basePeriod: 1h
exchanges: [{"eid":"Futures_Binance","currency":"BTC_USDT"}]
*/

//@version=3

strategy(title = "Super-Trend-reverse Strategy", overlay = true)

// Super Trend Strategy
Factor=input(2,type =float, minval=1,maxval = 100)
Pd=10 //input(10,minval=1,maxval = 100)

// ST1

UP=hlc3-(Factor*atr(Pd))

DOWN=hlc3+(Factor*atr(Pd))

// ST1.2

TrendUp=na
TrendUp:=close[1]>TrendUp[1]? max(UP,TrendUp[1]) : UP

TrendDown=na
TrendDown:=close[1]<TrendDown[1]? min(DOWN,TrendDown[1]) : UP


Trend = na
Tsl = na


Trend := close[1] > TrendDown[1] ? 1: close[1] < TrendUp[1]? -1: nz(Trend[1],1)
Tsl := Trend==1 ? TrendUp: TrendDown


/////////////// Functions for Reverse //////////////////////////////

IF(input) => (exp(2*input)-1) / (exp(2*input)+1)

//////////////////////// RSI REVERSE /////////////////////

RSI_main = input(14, title="RSI Main Period")
RSI_smooth = input(5, title="RSI Smooth Period")

//Functions
RVS(input) => (exp(2*input)-1) / (exp(2*input)+1)

//RSI Calculation
raw_RSI=0.1*(rsi(close,RSI_main)-50)
wma_RSI=wma(raw_RSI,RSI_smooth)
RVS_RSI = RVS(wma_RSI)


threshold1 = RVS_RSI < 0.8? 1 : 0
threshold2 = -0.8


RSIbuy = (RVS_RSI<threshold2)
RSIsell = (RVS_RSI > threshold1)


////////////////////// RSI REVERSE ///////////////////////

// Conditions


longCond = na
shortCond = na
longCond :=  RSIbuy and crossover(close, Tsl)
shortCond :=  RSIsell and crossunder(close, Tsl)


yearfrom = input(2018)
yearuntil =input(2039)
monthfrom =input(6)
monthuntil =input(12)
dayfrom=input(1)
dayuntil=input(31)


if (  longCond  and   year >= yearfrom and year <= yearuntil and month>=monthfrom and month <=monthuntil and dayofmonth>=dayfrom and dayofmonth < dayuntil)
    strategy.entry("BUY", strategy.long, stop=close, oca_name="TREND",  comment="BUY")

else
    strategy.cancel(id="BUY")


if ( shortCond and  year >= yearfrom and year <= yearuntil and month>=monthfrom and month <=monthuntil and dayofmonth>=dayfrom and dayofmonth < dayuntil )

    strategy.close("BUY")