概述
双均线紧缩趋势追踪策略(Dual Moving Average Convergence Trend Tracking Strategy)通过计算快速移动平均线、慢速移动平均线和超慢速移动平均线,结合MACD指标判断价格趋势方向,实现追踪趋势交易。当快慢均线发生黄金交叉时做多,死亡交叉时做空。同时通过长期均线过滤假突破。
策略原理
该策略首先计算了12日快速移动平均线、26日慢速移动平均线和200日超慢速移动平均线。当快速移动平均线上穿慢速移动平均线时为黄金交叉,表示开始牛市;当快速移动平均线从上向下跌破慢速移动平均线时为死亡交叉,表示开始熊市。策略在发生黄金交叉时做多,发生死亡交叉时做空。
同时,该策略结合MACD指标判断趋势方向。MACD由快线、慢线和MACD柱组成。快线上穿慢线时为多头信号,下穿为空头信号。结合长期均线过滤假信号,只有快线向上突破慢线,MACD柱由负转正,且价格站上200日移动平均线时才发出多头信号;只有快线向下跌破慢线,MACD柱由正转负,且价格跌破200日移动平均线时才发出空头信号。
通过快慢均线系统和MACD指标双重确认,避免因单一指标而产生的假信号,确保只在趋势开始时入场。
策略优势
快慢均线系统和MACD指标双重确认,避免假突破,确保只在趋势开始时入场。
200日移动平均线过滤,避免行情震荡期的错误交易。
有止损设置,可以限制最大亏损。
可以自定义参数,如移动平均线长度、止损水平等,适应不同品种。
策略思路清晰简单,容易理解和优化。
策略风险
长期跟踪趋势策略,无法捕捉短期机会。
追踪效果取决于参数设定,参数不当将无法正确捕捉趋势。
止损位置设定不当可能过于宽松或过于紧张,导致亏损扩大或过早止损。
长期持仓较多,需要承受一定的资金压力。
策略优化
优化移动平均线长度参数,寻找最佳参数组合。
添加其他指标作为辅助判断信号,如KDJ指标等。
优化止损策略,如缩小止损,跟踪止损等方式。
根据品种和交易周期调整移动平均线参数。
结合量能指标如成交量等过滤假信号。
总结
双均线紧缩趋势追踪策略通过计算多个均线系统判断趋势方向,并利用MACD指标过滤信号,其优势是操作思路简单清晰,风险可控,适合对趋势进行追踪。该策略可通过参数优化、止损策略优化、辅助指标等多种方式进行改进,是一种值得推荐的趋势追踪策略。
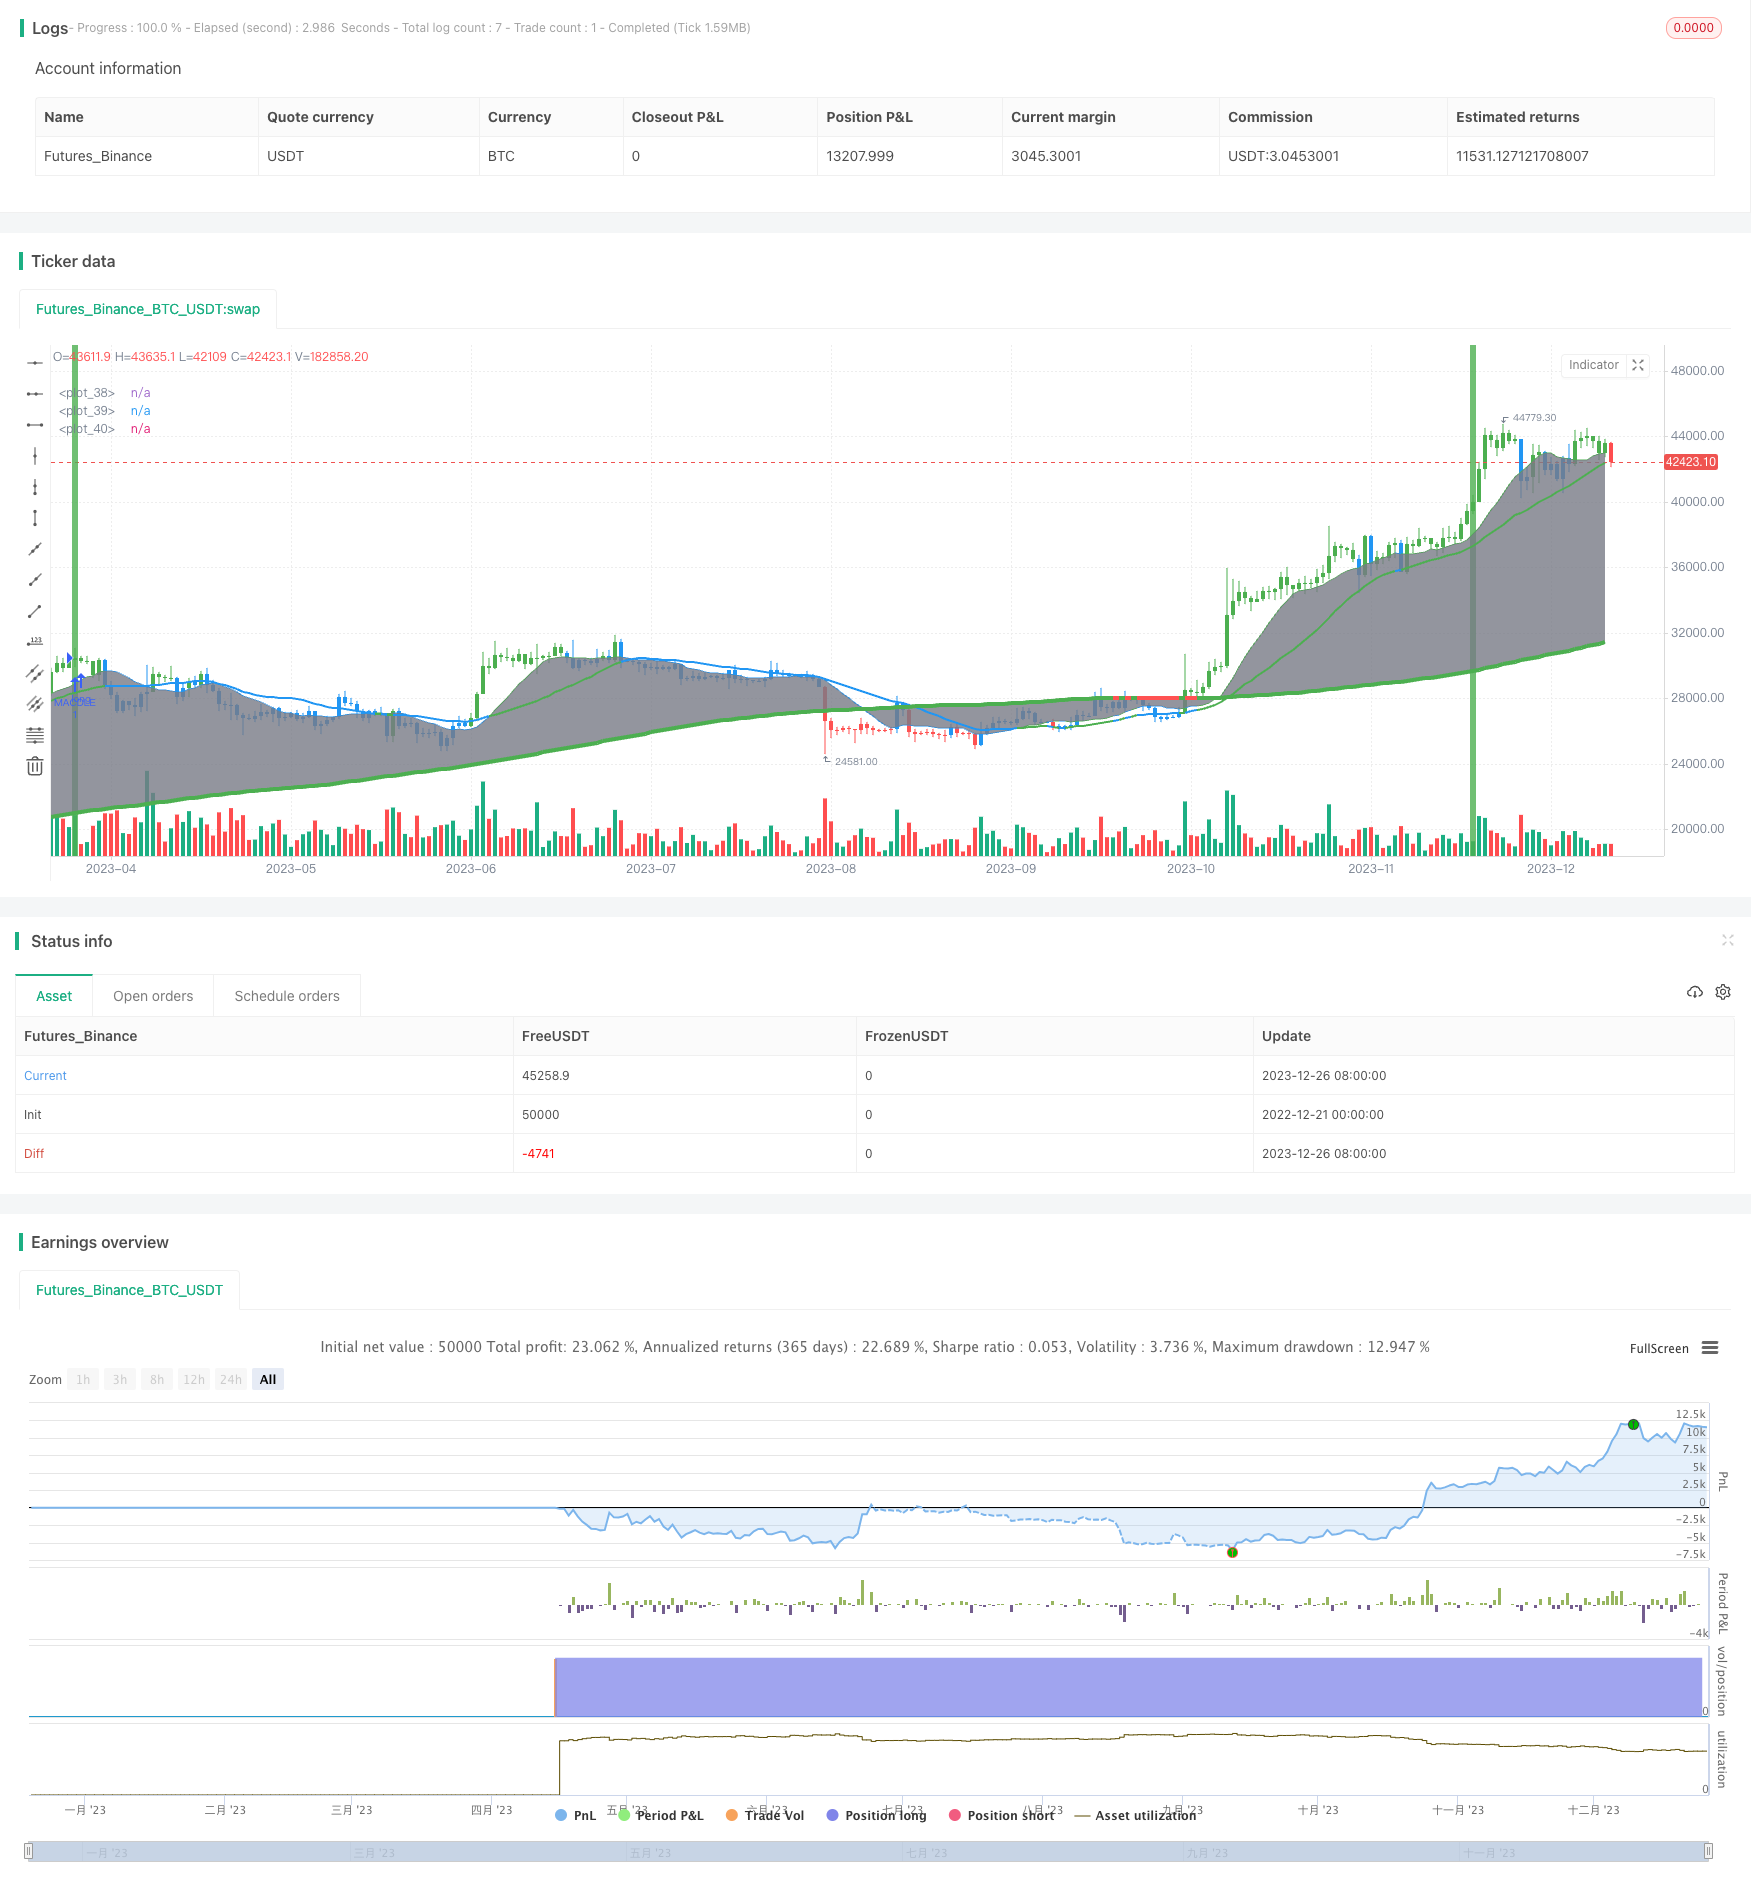
/*backtest
start: 2022-12-21 00:00:00
end: 2023-12-27 00:00:00
period: 1d
basePeriod: 1h
exchanges: [{"eid":"Futures_Binance","currency":"BTC_USDT"}]
*/

//@version=2
strategy("Trend Strategy", shorttitle="TSTrend Strategy", overlay=true)


// Trend Strategy
// If the inverse logic is true, the strategy
// goes short. For the worst case there is a
// max intraday equity loss of 50% filter.


// Input
source = input(close)
fastLength = input(12, minval=1, title="MACD fast moving average")
slowLength=input(26,minval=1, title="MACD slow moving average")
signalLength=input(9,minval=1, title="MACD signal line moving average")
veryslowLength=input(200,minval=1, title="Very slow moving average")
switch1=input(true, title="Enable Bar Color?")
switch2=input(true, title="Enable Moving Averages?")
switch3=input(true, title="Enable Background Color?")

// Calculation
fastMA = sma(source, fastLength)
slowMA = sma(source, slowLength)
veryslowMA = sma(source, veryslowLength)
macd = fastMA - slowMA
signal = sma(macd, signalLength)
hist = macd - signal

// Colors
MAtrendcolor = change(veryslowMA) > 0 ? green : red
trendcolor = fastMA > slowMA and change(veryslowMA) > 0 and close > slowMA ? green : fastMA < slowMA and change(veryslowMA) < 0 and close < slowMA ? red : blue
bartrendcolor = close > fastMA and close > slowMA and close > veryslowMA and change(slowMA) > 0 ? green : close < fastMA and close < slowMA and close < veryslowMA and change(slowMA) < 0 ? red : blue
backgroundcolor = slowMA > veryslowMA and crossover(hist, 0) and macd > 0 and fastMA > slowMA and close[slowLength] > veryslowMA ? green : slowMA < veryslowMA and crossunder(hist, 0) and macd < 0 and fastMA < slowMA and close[slowLength] < veryslowMA ? red : na
bgcolor(switch3?backgroundcolor:na,transp=80)
barcolor(switch1?bartrendcolor:na)

// Output
F=plot(switch2?fastMA:na,color=trendcolor)
S=plot(switch2?slowMA:na,color=trendcolor,linewidth=2)
V=plot(switch2?veryslowMA:na,color=MAtrendcolor,linewidth=4)
fill(F,V,color=gray)

// Strategy
buyprice = low
sellprice = high
cancelLong = slowMA < veryslowMA
cancelShort = slowMA > veryslowMA

if (cancelLong)
    strategy.cancel("MACDLE")

if crossover(hist, 0) and macd > 0 and fastMA > slowMA and close[slowLength] > veryslowMA
    strategy.entry("MACDLE", strategy.long, stop=buyprice, comment="Bullish")

if (cancelShort)
    strategy.cancel("MACDSE")

if crossunder(hist, 0) and macd < 0 and fastMA < slowMA and close[slowLength] < veryslowMA
    strategy.entry("MACDSE", strategy.short, stop=sellprice, comment="Bearish")

// maxIdLossPcnt = input(50, "Max Intraday Loss(%)", type=float)
// strategy.risk.max_intraday_loss(maxIdLossPcnt, strategy.percent_of_equity)

//plot(strategy.equity, title="equity", color=red, linewidth=2, style=areabr)