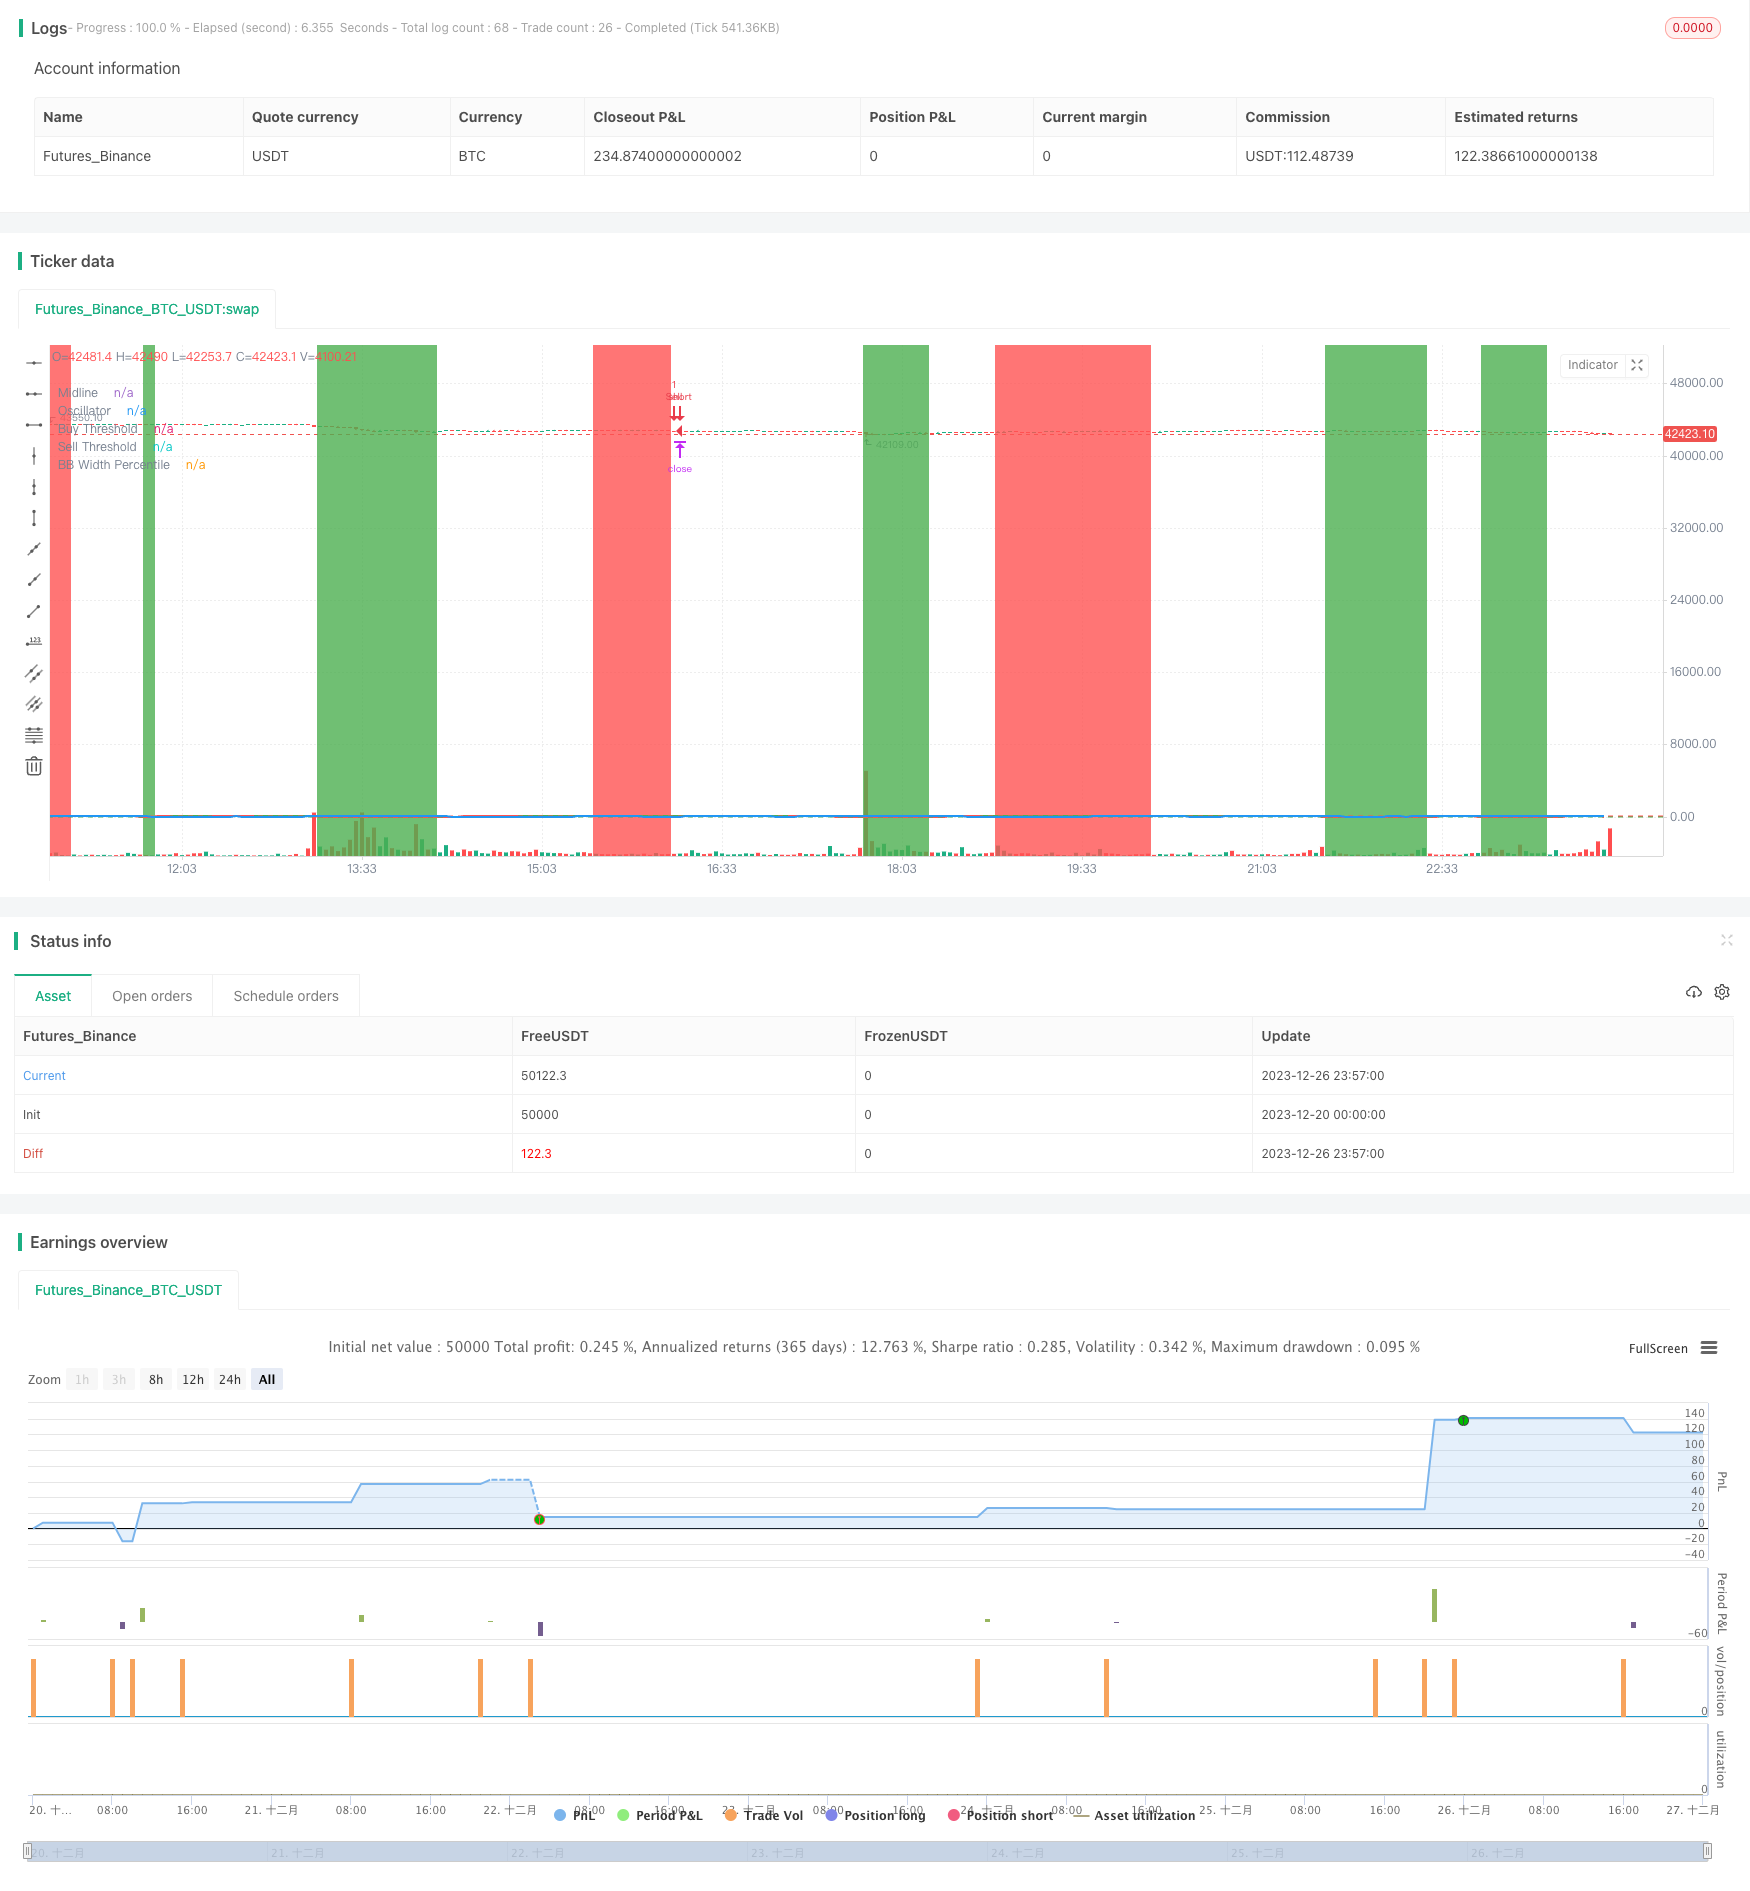
概述
本策略是基于双重移动平均线比率指标,结合布林带过滤器和双重趋势过滤指标,采用链式退出机制的趋势跟随策略。该策略旨在利用移动平均线比率指标识别中长线趋势方向,在趋势方向明确时选择较好的入场点入场,并设置止盈、止损退出机制锁定利润,降低损失。
策略原理
- 计算快速移动平均线(10日线)和慢速移动平均线(50日线),并计算它们的比率,称为价格移动平均线比率。该比率可以有效识别价格中长线趋势的变化。
- 将价格移动平均线比率转换为百分位数,即当前比率在过去一段时间内的相对强弱。该百分位数被定义为振荡器。
- 当振荡器上穿设定的买入阈值(10)时产生买入信号,下破卖出阈值(90)时产生卖出信号,进行趋势跟随。
- 结合布林带宽度指标对交易信号进行过滤,布林带收窄时进行操作。
- 采用双重趋势过滤指标,只有当价格处于上升趋势通道时才产生买入信号,只有当价格处于下降通道时才产生卖出信号,从而避免逆势操作。
- 设置链式退出机制,包括止盈、止损和组合退出,可预设多个退出条件,优先退出获利最大的条件。
策略优势
- 双重趋势过滤机制,可靠判断主趋势方向,避免逆势操作。
- 移动平均线比率指标比单一移动平均线更有效判断趋势变化。
- 布林带宽度指标可有效定位市场的低波动期,这时交易信号更加可靠。
- 链式退出机制使盈利更稳定,将全部利润最大化。
风险及解决方法
- 在震荡行情中无明显趋势时,会出现较多的错误信号和反转。解决方法是结合布林带宽度过滤,收窄时进行操作。
- 当出现明显趋势反转时,移动平均线会产生滞后性,并不能第一时间判断出反转信号。解决方法是适当缩短移动平均线周期参数。
- 在行情出现跳空缺口时,止损点可能会被瞬间击中,造成较大损失。解决方法是适当放宽止损点的参数。
策略优化方向
- 参数优化。可对移动平均线周期、振荡器买卖点、布林带参数、趋势过滤参数进行穷举测试,寻找最佳参数组合。
- 融入其他指标。可考虑加入其它判断趋势反转的指标,如KD指标、MACD指标等,提高策略的准确性。
- 机器学习。可以收集历史数据,利用机器学习算法训练模型,动态优化各项参数,实现参数的自适应调整。
总结
本策略综合运用双重移动平均线比率指标和布林带指标判断中长线趋势方向,在确认趋势后寻找最佳入场点入场,并设置链式退出机制锁定利润,可靠度较高,效果明显。该策略可通过参数优化、增加其他辅助判断指标以及机器学习进一步改进和提高获利率。
策略源码
/*backtest
start: 2023-12-20 00:00:00
end: 2023-12-27 00:00:00
period: 3m
basePeriod: 1m
exchanges: [{"eid":"Futures_Binance","currency":"BTC_USDT"}]
*/

//@version=4
strategy("Premium MA Ratio Strategy", overlay = true)

// Input: Adjustable parameters for Premium MA Ratio
fast_length = input(10, title = "Fast MA Length")
slow_length = input(50, title = "Slow MA Length")
oscillator_threshold_buy = input(10, title = "Oscillator Buy Threshold")
oscillator_threshold_sell = input(90, title = "Oscillator Sell Threshold")

// Input: Adjustable parameters for Bollinger Bands
bb_length = input(20, title = "Bollinger Bands Length")
bb_source = input(close, title = "Bollinger Bands Source")
bb_deviation = input(2.0, title = "Bollinger Bands Deviation")
bb_width_threshold = input(30, title = "BB Width Threshold")
use_bb_filter = input(true, title = "Use BB Width Filter?")

// Input: Adjustable parameters for Trend Filter
use_trend_filter = input(true, title = "Use Trend Filter?")
trend_filter_period_1 = input(50, title = "Trend Filter Period 1")
trend_filter_period_2 = input(200, title = "Trend Filter Period 2")
use_second_trend_filter = input(true, title = "Use Second Trend Filter?")

// Input: Adjustable parameters for Exit Strategies
use_exit_strategies = input(true, title = "Use Exit Strategies?")
use_take_profit = input(true, title = "Use Take Profit?")
take_profit_ticks = input(150, title = "Take Profit in Ticks")
use_stop_loss = input(true, title = "Use Stop Loss?")
stop_loss_ticks = input(100, title = "Stop Loss in Ticks")
use_combined_exit = input(true, title = "Use Combined Exit Strategy?")
combined_exit_ticks = input(50, title = "Combined Exit Ticks")

// Input: Adjustable parameters for Time Filter
use_time_filter = input(false, title = "Use Time Filter?")
start_hour = input(8, title = "Start Hour")
end_hour = input(16, title = "End Hour")

// Calculate moving averages
fast_ma = sma(close, fast_length)
slow_ma = sma(close, slow_length)

// Calculate the premium price moving average ratio
premium_ratio = fast_ma / slow_ma * 100

// Calculate the percentile rank of the premium ratio
percentile_rank(src, length) =>
    rank = 0.0
    for i = 1 to length
        if src > src[i]
            rank := rank + 1.0
    percentile = rank / length * 100

// Calculate the percentile rank for the premium ratio using slow_length periods
premium_ratio_percentile = percentile_rank(premium_ratio, slow_length)

// Calculate the oscillator based on the percentile rank
oscillator = premium_ratio_percentile

// Dynamic coloring for the oscillator line
oscillator_color = oscillator > 50 ? color.green : color.red

// Plot the oscillator on a separate subplot as a line
hline(50, "Midline", color = color.gray)
plot(oscillator, title = "Oscillator", color = oscillator_color, linewidth = 2)

// Highlight the overbought and oversold areas
bgcolor(oscillator > oscillator_threshold_sell ? color.red : na, transp = 80)
bgcolor(oscillator < oscillator_threshold_buy ? color.green : na, transp = 80)

// Plot horizontal lines for threshold levels
hline(oscillator_threshold_buy, "Buy Threshold", color = color.green)
hline(oscillator_threshold_sell, "Sell Threshold", color = color.red)

// Calculate Bollinger Bands width
bb_upper = sma(bb_source, bb_length) + bb_deviation * stdev(bb_source, bb_length)
bb_lower = sma(bb_source, bb_length) - bb_deviation * stdev(bb_source, bb_length)
bb_width = bb_upper - bb_lower

// Calculate the percentile rank of Bollinger Bands width
bb_width_percentile = percentile_rank(bb_width, bb_length)

// Plot the Bollinger Bands width percentile line
plot(bb_width_percentile, title = "BB Width Percentile", color = color.blue, linewidth = 2)

// Calculate the trend filters
trend_filter_1 = sma(close, trend_filter_period_1)
trend_filter_2 = sma(close, trend_filter_period_2)

// Strategy logic
longCondition = crossover(premium_ratio_percentile, oscillator_threshold_buy)
shortCondition = crossunder(premium_ratio_percentile, oscillator_threshold_sell)

// Apply Bollinger Bands width filter if enabled
if (use_bb_filter)
    longCondition := longCondition and bb_width_percentile < bb_width_threshold
    shortCondition := shortCondition and bb_width_percentile < bb_width_threshold

// Apply trend filters if enabled
if (use_trend_filter)
    longCondition := longCondition and (close > trend_filter_1)
    shortCondition := shortCondition and (close < trend_filter_1)

// Apply second trend filter if enabled
if (use_trend_filter and use_second_trend_filter)
    longCondition := longCondition and (close > trend_filter_2)
    shortCondition := shortCondition and (close < trend_filter_2)

// Apply time filter if enabled
if (use_time_filter)
    longCondition := longCondition and (hour >= start_hour and hour <= end_hour)
    shortCondition := shortCondition and (hour >= start_hour and hour <= end_hour)

// Generate trading signals with exit strategies
if (use_exit_strategies)
    strategy.entry("Buy", strategy.long, when = longCondition)
    strategy.entry("Sell", strategy.short, when = shortCondition)

    // Define unique exit names for each order
    buy_take_profit_exit = "Buy Take Profit"
    buy_stop_loss_exit = "Buy Stop Loss"
    sell_take_profit_exit = "Sell Take Profit"
    sell_stop_loss_exit = "Sell Stop Loss"
    combined_exit = "Combined Exit"

    // Exit conditions for take profit
    if (use_take_profit)
        strategy.exit(buy_take_profit_exit, from_entry = "Buy", profit = take_profit_ticks)
        strategy.exit(sell_take_profit_exit, from_entry = "Sell", profit = take_profit_ticks)

    // Exit conditions for stop loss
    if (use_stop_loss)
        strategy.exit(buy_stop_loss_exit, from_entry = "Buy", loss = stop_loss_ticks)
        strategy.exit(sell_stop_loss_exit, from_entry = "Sell", loss = stop_loss_ticks)

    // Combined exit strategy
    if (use_combined_exit)
        strategy.exit(combined_exit, from_entry = "Buy", loss = combined_exit_ticks, profit = combined_exit_ticks)