概述
相对量价策略是一种基于交易量异常和价格波动的量化交易策略。该策略通过比较当前交易量与历史平均交易量的关系,判断交易量是否异常;同时结合平均真实波幅区间,判断价格是否处于相对稳定的区间。当交易量异常增加且价格相对稳定时,认为是进入信号。
策略原理
相对量价策略的核心逻辑基于两个指标进行判断,一个是相对交易量,一个是价格波动区间。
首先,我们计算最近 20 周期的交易量的简单移动平均,作为历史平均交易量。然后设置一个倍数参数(如 1.5 倍),当当前交易量大于平均交易量的 1.5 倍时,我们认为交易量异常,属于“相对量”的情况。
其次,我们计算最近 14 周期的平均真实波幅(ATR)作为价格波动的度量。同时计算平均波幅的标准差,如果当前真实波幅位于平均值正负一个标准差之间,我们认为价格波动处于相对平稳的区间。
当上述两个条件同时满足时,即发出做多信号,开仓做多。持仓过程中,以最大低点减去两倍 ATR 作为止损位,以最高点减去两倍 ATR 作为止盈位。
优势分析
相对量价策略最大的优势在于捕捉异常交易量带来的价格趋势。当交易量激增时,代表了市场参与者态度的改变,这常常预示着价格的突破和新趋势的形成。策略通过比较交易量与历史平均值的关系,可有效判断交易量异常的时点。
另一方面,策略还考虑了价格波动率,使得信号发生在价格相对平稳的时段。这避免了在剧烈波动时追高造成的巨大亏损风险。同时也增加了获利机会,因为趋势通常在相对平稳后才开始突破。
风险分析
该策略最大的风险在于交易量指标并不能百分之百确定新的趋势,交易量激增有可能是假突破,价格很快就反转。这种情况下,策略vrfs受到较大损失。
为降低损失,可适当调整“相对量”的参数,对交易量异常的判断设更严格的标准。或者增加其他判断指标,如增加成交额分析,判断交易量增长是否与成交金额匹配。
优化方向
该策略可以从以下几个方面进行优化:
增加其他指标判断,如涨跌幅,成交额等,使交易量异常信号更加可靠。
ATR 参数可针对不同股票进行优化,更准确判断价格稳定区间。
增加机器学习算法,对交易量异常进行积极判断,而不仅是与历史平均值简单比较。
利用深度学习模型判断价格波动预测,而不仅仅是基于历史ATR。
总结
相对量价策略通过捕捉交易量异常作为特征信号,结合价格稳定判断发出交易信号。策略简单实用,在追踪股票异常交易量时效果较好。但也存在一定的假信号风险,需进一步优化指标判断以提高效果。
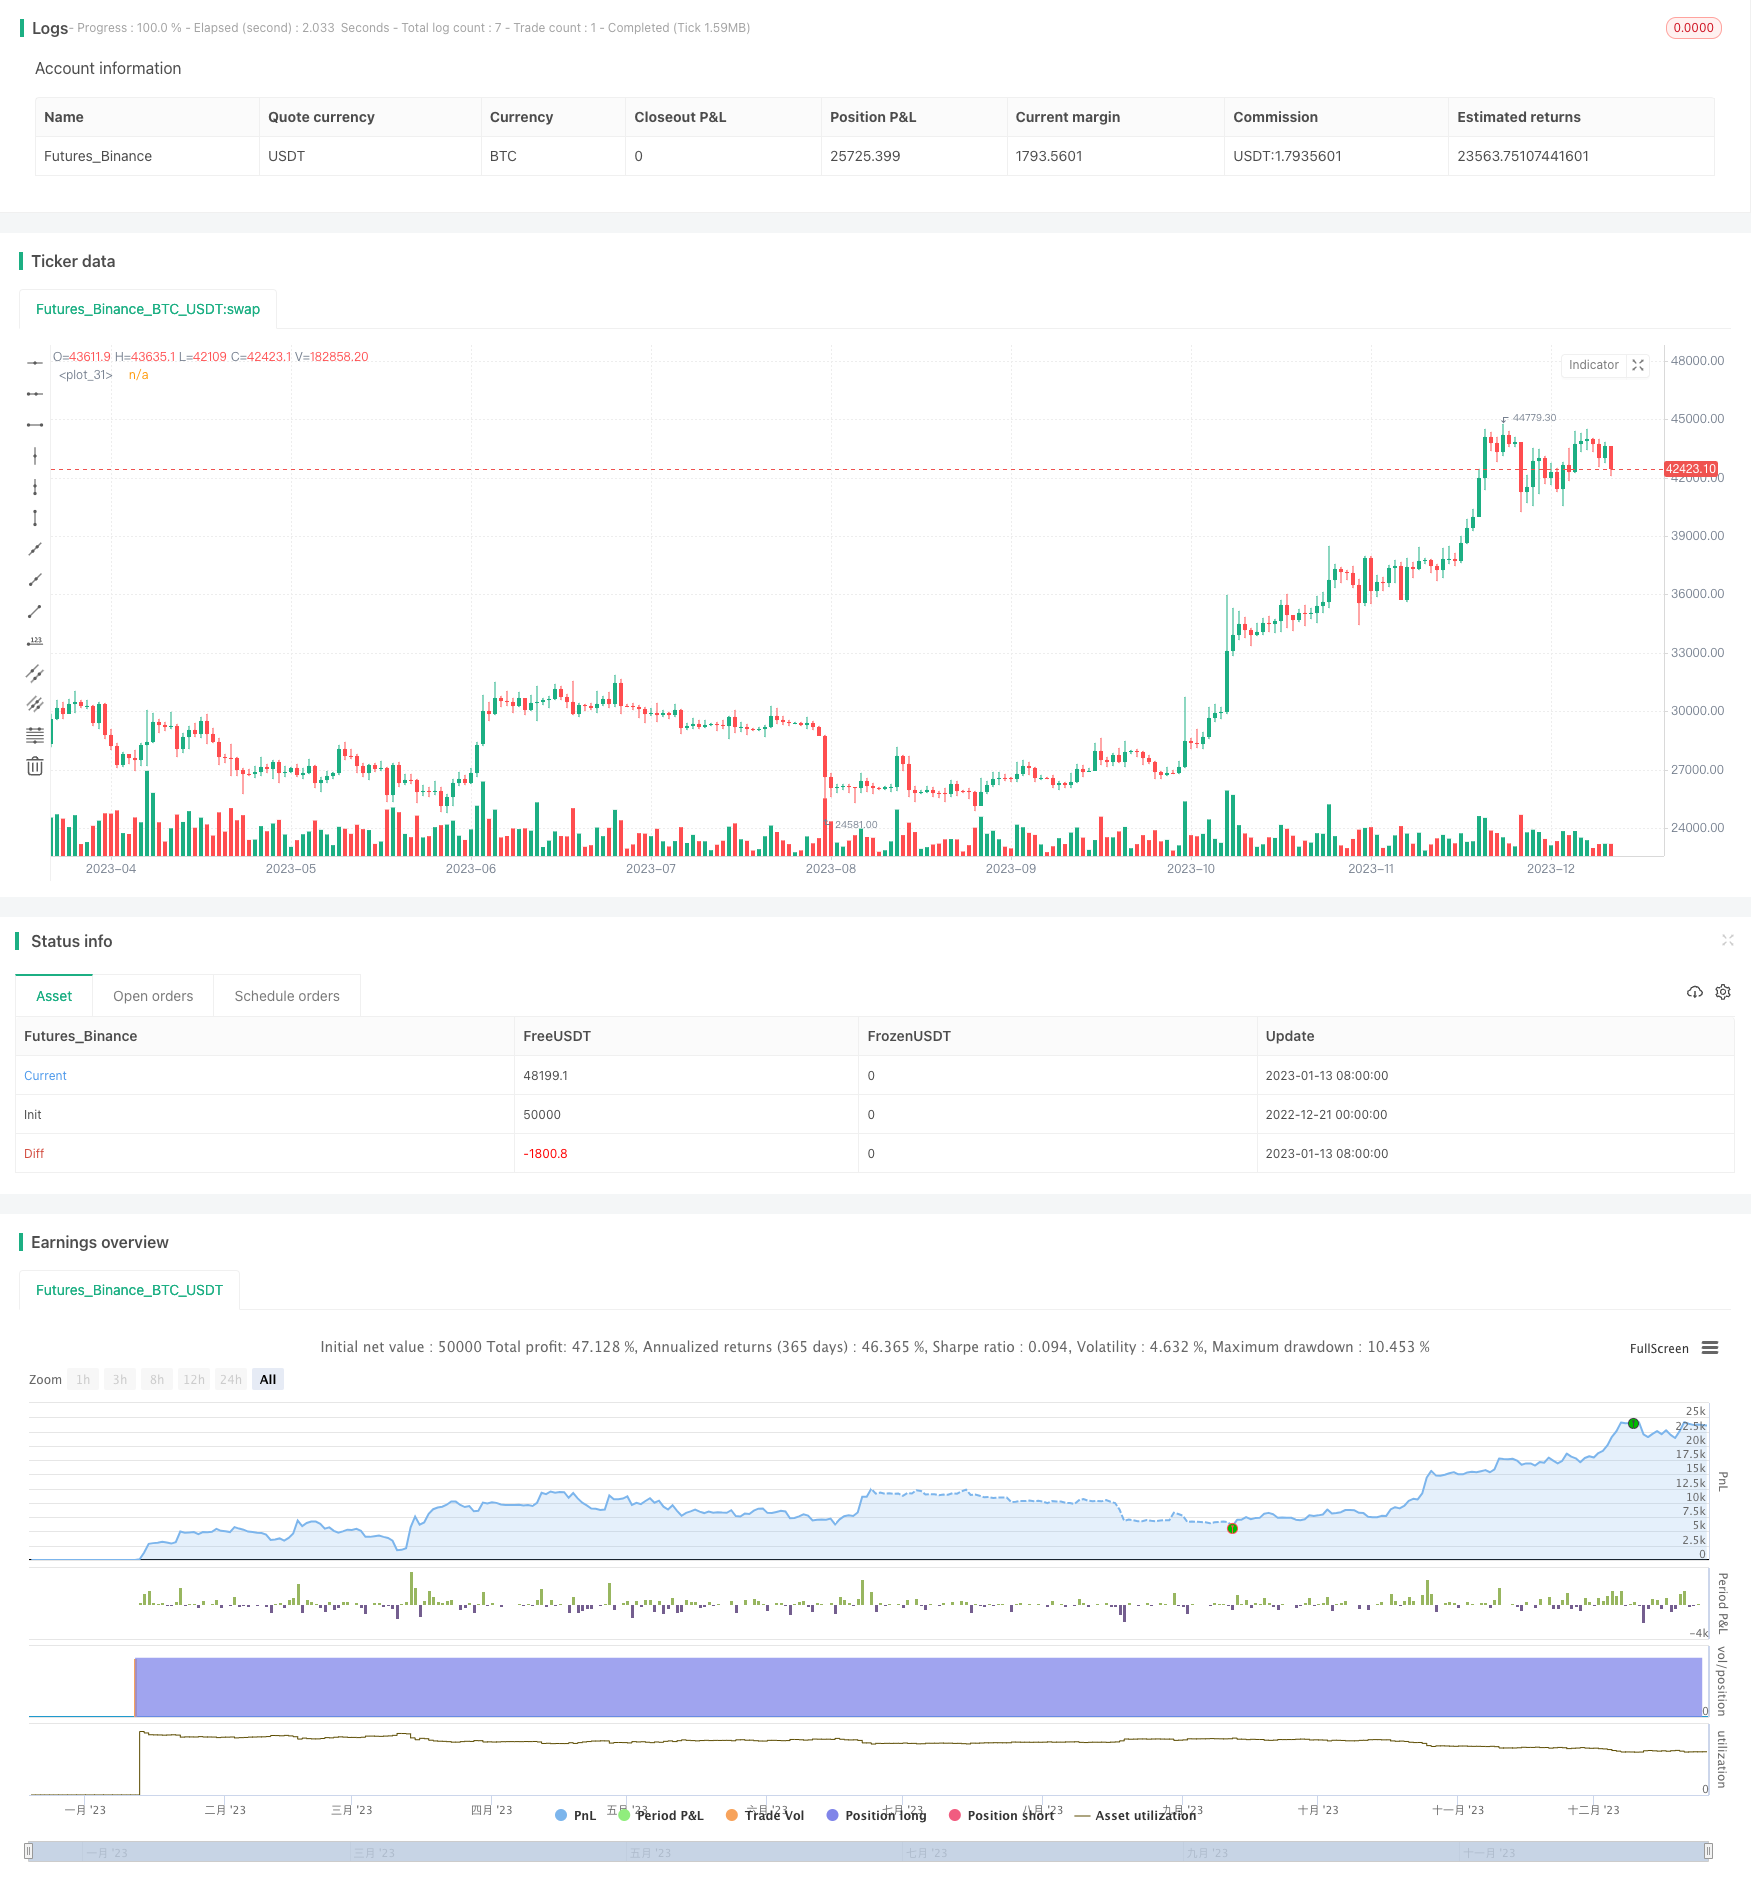
/*backtest
start: 2022-12-21 00:00:00
end: 2023-12-27 00:00:00
period: 1d
basePeriod: 1h
exchanges: [{"eid":"Futures_Binance","currency":"BTC_USDT"}]
*/

// This source code is subject to the terms of the Mozilla Public License 2.0 at https://mozilla.org/MPL/2.0/
// © DojiEmoji (kevinhhl)

//@version=4
strategy("[KL] Relative Volume + ATR Strategy",overlay=true,pyramiding=1)
ENUM_LONG = "Long"

// Timeframe {
backtest_timeframe_start = input(defval = timestamp("01 Apr 2016 13:30 +0000"), title = "Backtest Start Time", type = input.time)
USE_ENDTIME = input(false,title="Define backtest end-time (If false, will test up to most recent candle)")
backtest_timeframe_end = input(defval = timestamp("01 May 2021 19:30 +0000"), title = "Backtest End Time (if checked above)", type = input.time)
within_timeframe = true
// }
len_volat = input(14,title="Length of ATR to determine volatility")
ATR_volat = atr(len_volat)
avg_ATR_volat  = sma(ATR_volat, len_volat)
std_ATR_volat = stdev(ATR_volat, len_volat)
// }

// Trailing stop loss {
ATR_X2_TSL = atr(input(14,title="Length of ATR for trailing stop loss")) * input(2.0,title="ATR Multiplier for trailing stop loss",type=input.float)
TSL_source = low
var stop_loss_price = float(0)
TSL_line_color = color.green, TSL_transp = 100
if strategy.position_size == 0 or not within_timeframe
    TSL_line_color := color.black
    stop_loss_price := TSL_source - ATR_X2_TSL
else if strategy.position_size > 0
    stop_loss_price := max(stop_loss_price, TSL_source - ATR_X2_TSL)
    TSL_transp := 0
plot(stop_loss_price, color=color.new(TSL_line_color, TSL_transp))
// }

// Signals for entry {
_avg_vol = sma(volume,input(20, title="SMA(volume) length (for relative comparison)"))
_relative_vol = _avg_vol * input(1.5,title="Multiple of avg vol to consider relative volume as being high",type=input.float)
__lowerOfOpenClose = min(open,close)
_wickRatio_lower = (__lowerOfOpenClose - low) / (high - low)
entry_signal1 = volume > _relative_vol
entry_signal2 = ATR_volat < avg_ATR_volat + std_ATR_volat and ATR_volat > avg_ATR_volat - std_ATR_volat
// }


alert_per_bar(msg)=>
    prefix = "[" + syminfo.root + "] "
    suffix = "(P=" + tostring(close) + "; atr=" + tostring(ATR_volat) + ")"
    alert(tostring(prefix) + tostring(msg) + tostring(suffix), alert.freq_once_per_bar)

// MAIN:
if within_timeframe
    if strategy.position_size > 0 and strategy.position_size[1] > 0 and (stop_loss_price/stop_loss_price[1]-1) > 0.005
        alert_per_bar("TSL raised to " + tostring(stop_loss_price))

    // EXIT ::::::::::::::::::::::::::::::::::::::::::::::::::::::::::::::::::::    // placed before entry, will re-enter if stopped out
	exit_msg = close <= strategy.position_avg_price ? "stop loss" : "take profit"
	if strategy.position_size > 0 and TSL_source <= stop_loss_price
        strategy.close(ENUM_LONG, comment=exit_msg)

    // ENTRY :::::::::::::::::::::::::::::::::::::::::::::::::::::::::::::::::::
	if entry_signal1 and entry_signal2// and entry_signal3
		entry_msg = strategy.position_size > 0 ? "adding" : "initial"
		strategy.entry(ENUM_LONG, strategy.long, comment=entry_msg)

// CLEAN UP:
if strategy.position_size == 0
	stop_loss_price := float(0)