概述
慢速RSI超买超卖策略通过延长RSI的回看周期,降低RSI曲线的波动性,从而开启全新的交易机会。该策略同样也适用于MACD等其他技术指标。
策略原理
该策略的核心思路是延长RSI的回看周期长度,默认为500周期,然后再通过SMA平滑RSI曲线,默认周期为250。这样可以大幅降低RSI曲线的波动性,缓慢RSI的反应速度,从而产生新的交易机会。
过长的回看周期削弱了RSI曲线的波动性,因此判断超买超卖的标准也需要调整。策略设置了自定义的超买线52和超卖线48。当加权RSI从下方突破超卖线时产生做多信号;当从上方跌破超买线时产生做空信号。
策略优势
- 创新性强,通过延长周期开辟新的交易思路
- 可大幅降低虚假信号,提高稳定性
- 可自定义超买超卖阈值,适应不同市场
- 可播种加仓,提高收益率
策略风险
- 周期过长可能错过短线机会
- 需要耐心等待入场机会出现
- 超买超卖阈值设置不当可能增加损失
- 存在被套利的风险
解决方法:
- 适当缩短周期,增加交易频率
- 采用分批建仓的方式,分散风险
- 优化阈值参数,适应不同市场环境
- 设置止损点,避免巨额损失
策略优化方向
- 优化RSI的参数,找到最佳周期组合
- 测试不同的SMA平滑周期参数
- 优化超买超卖的参数,拟合不同市场
- 添加止损策略,控制单笔损失
总结
慢速RSI超买超卖策略通过延长周期和利用均线抑制波动的方式,成功开辟了新的交易思路。该策略在参数优化和风险控制到位的情况下,有望取得稳定而高效的超额收益。总体来说,该策略具有很强的创新性和运用价值。
策略源码
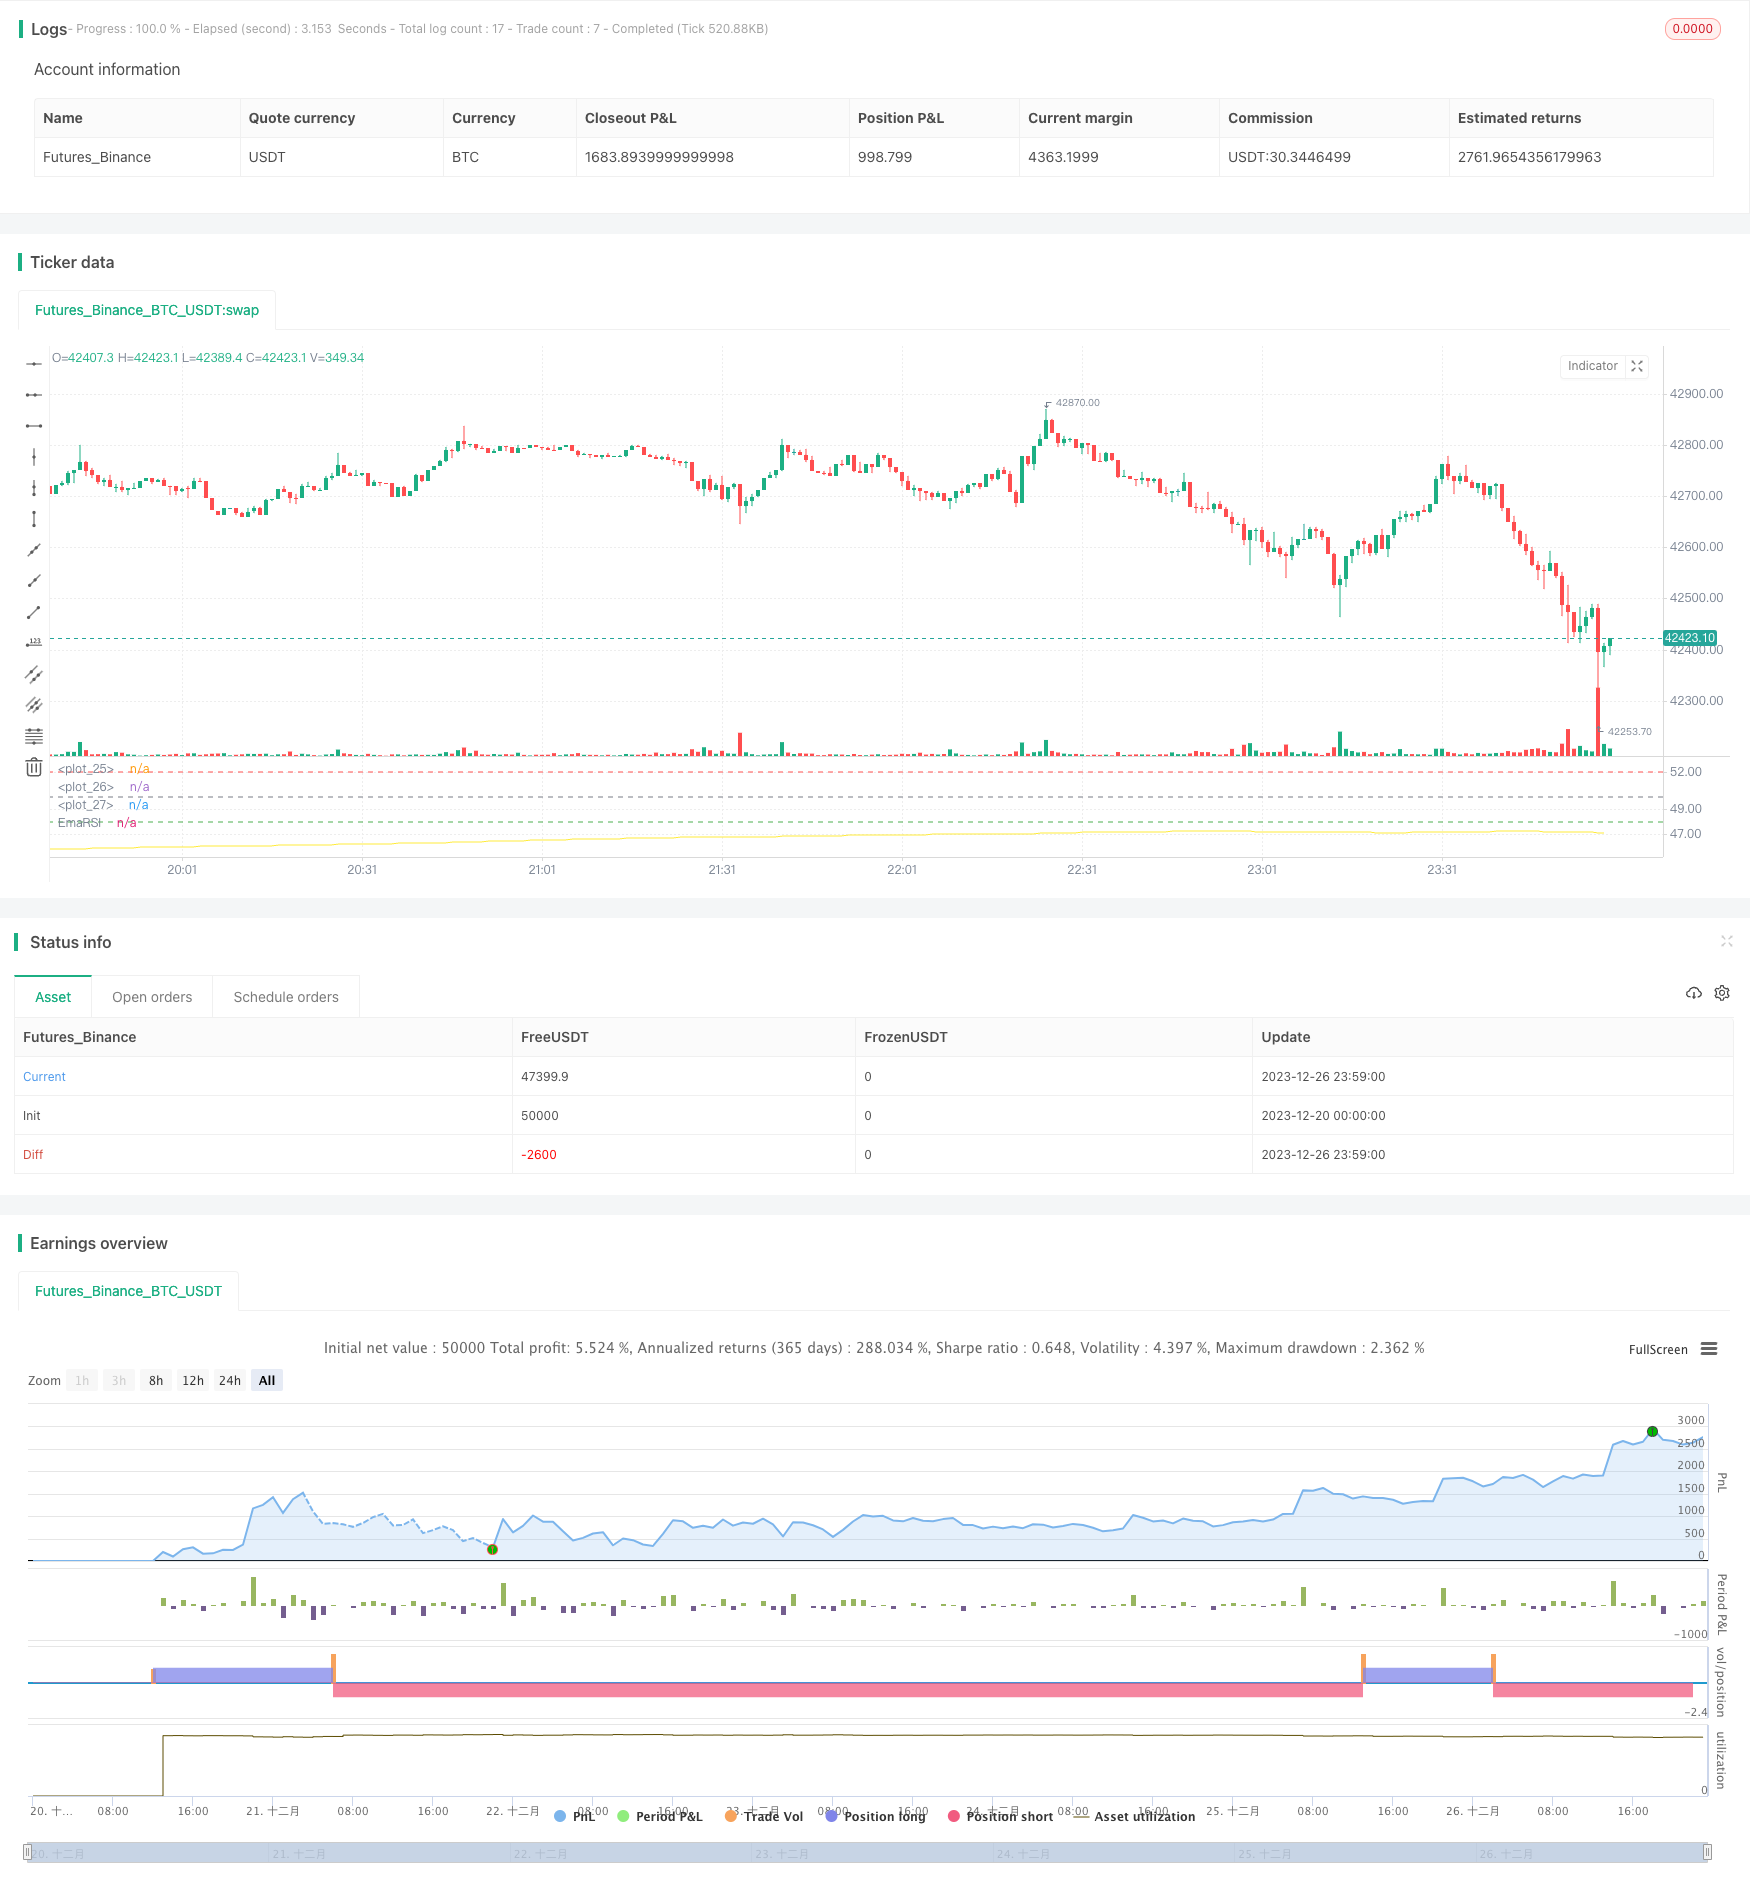
/*backtest
start: 2023-12-20 00:00:00
end: 2023-12-27 00:00:00
period: 1m
basePeriod: 1m
exchanges: [{"eid":"Futures_Binance","currency":"BTC_USDT"}]
*/


// Wilder was a very influential man when it comes to TA. However, I'm one to always try to think outside the box.
// While Wilder recommended that the RSI be used only with a 14 bar lookback period, I on the other hand think there is a lot to learn from RSI if one simply slows down the lookback period
// Same applies for MACD.
// Every market has its dynmaics. So don't narrow your mind by thinking my source code input levels are the only levels that work.
// Since the long lookback period weakens the plot volatility, again, one must think outside the box when trying to guage overbought and oversold levels.

// Good luck and don't bash me if some off-the-wall FA spurned divergence causes you to lose money.
// And NO this doesn't repaint and I won't answer those who ask.
//@version=4

strategy("SLOW RSI OB/OS Strategy", overlay=false)
price = input(ohlc4, title="Price Source")
len = input(500, minval=1, step=5,  title="RSI Length")
smoother = input(250, minval=1, step=5, title="RSI SMA")
up = rma(max(change(price), 0), len)
down = rma(-min(change(price), 0), len)
rsi = down == 0 ? 100 : up == 0 ? 0 : 100 - (100 / (1 + up / down))
EmaRSI = ema(rsi,smoother)
plot(EmaRSI, title="EmaRSI", style=line, linewidth=1, color=yellow)


OB = input(52, step=0.1)
OS = input(48, step=0.1)
hline(OB, linewidth=1, color=red)
hline(OS,linewidth=1, color=green)
hline(50,linewidth=1, color=gray)


long = change(EmaRSI) > 0 and EmaRSI <= 50 and crossover(EmaRSI, OS)
short = change(EmaRSI) < 0 and EmaRSI >= 50 and crossunder(EmaRSI, OB)


strategy.entry("Long", strategy.long, when=long) //_signal or long) //or closeshort_signal)
strategy.entry("Short", strategy.short, when=short) //_signal or short) // or closelong_signal)

// If you want to try to play with exits you can activate these!

//closelong = crossunder(EmaRSI, 0) //or crossunder(EmaRSI, OS)
//closeshort = crossover(EmaRSI, 0) //or crossover(EmaRSI, OB)

//strategy.close("Long", when=closelong)
//strategy.close("Short", when=closeshort)