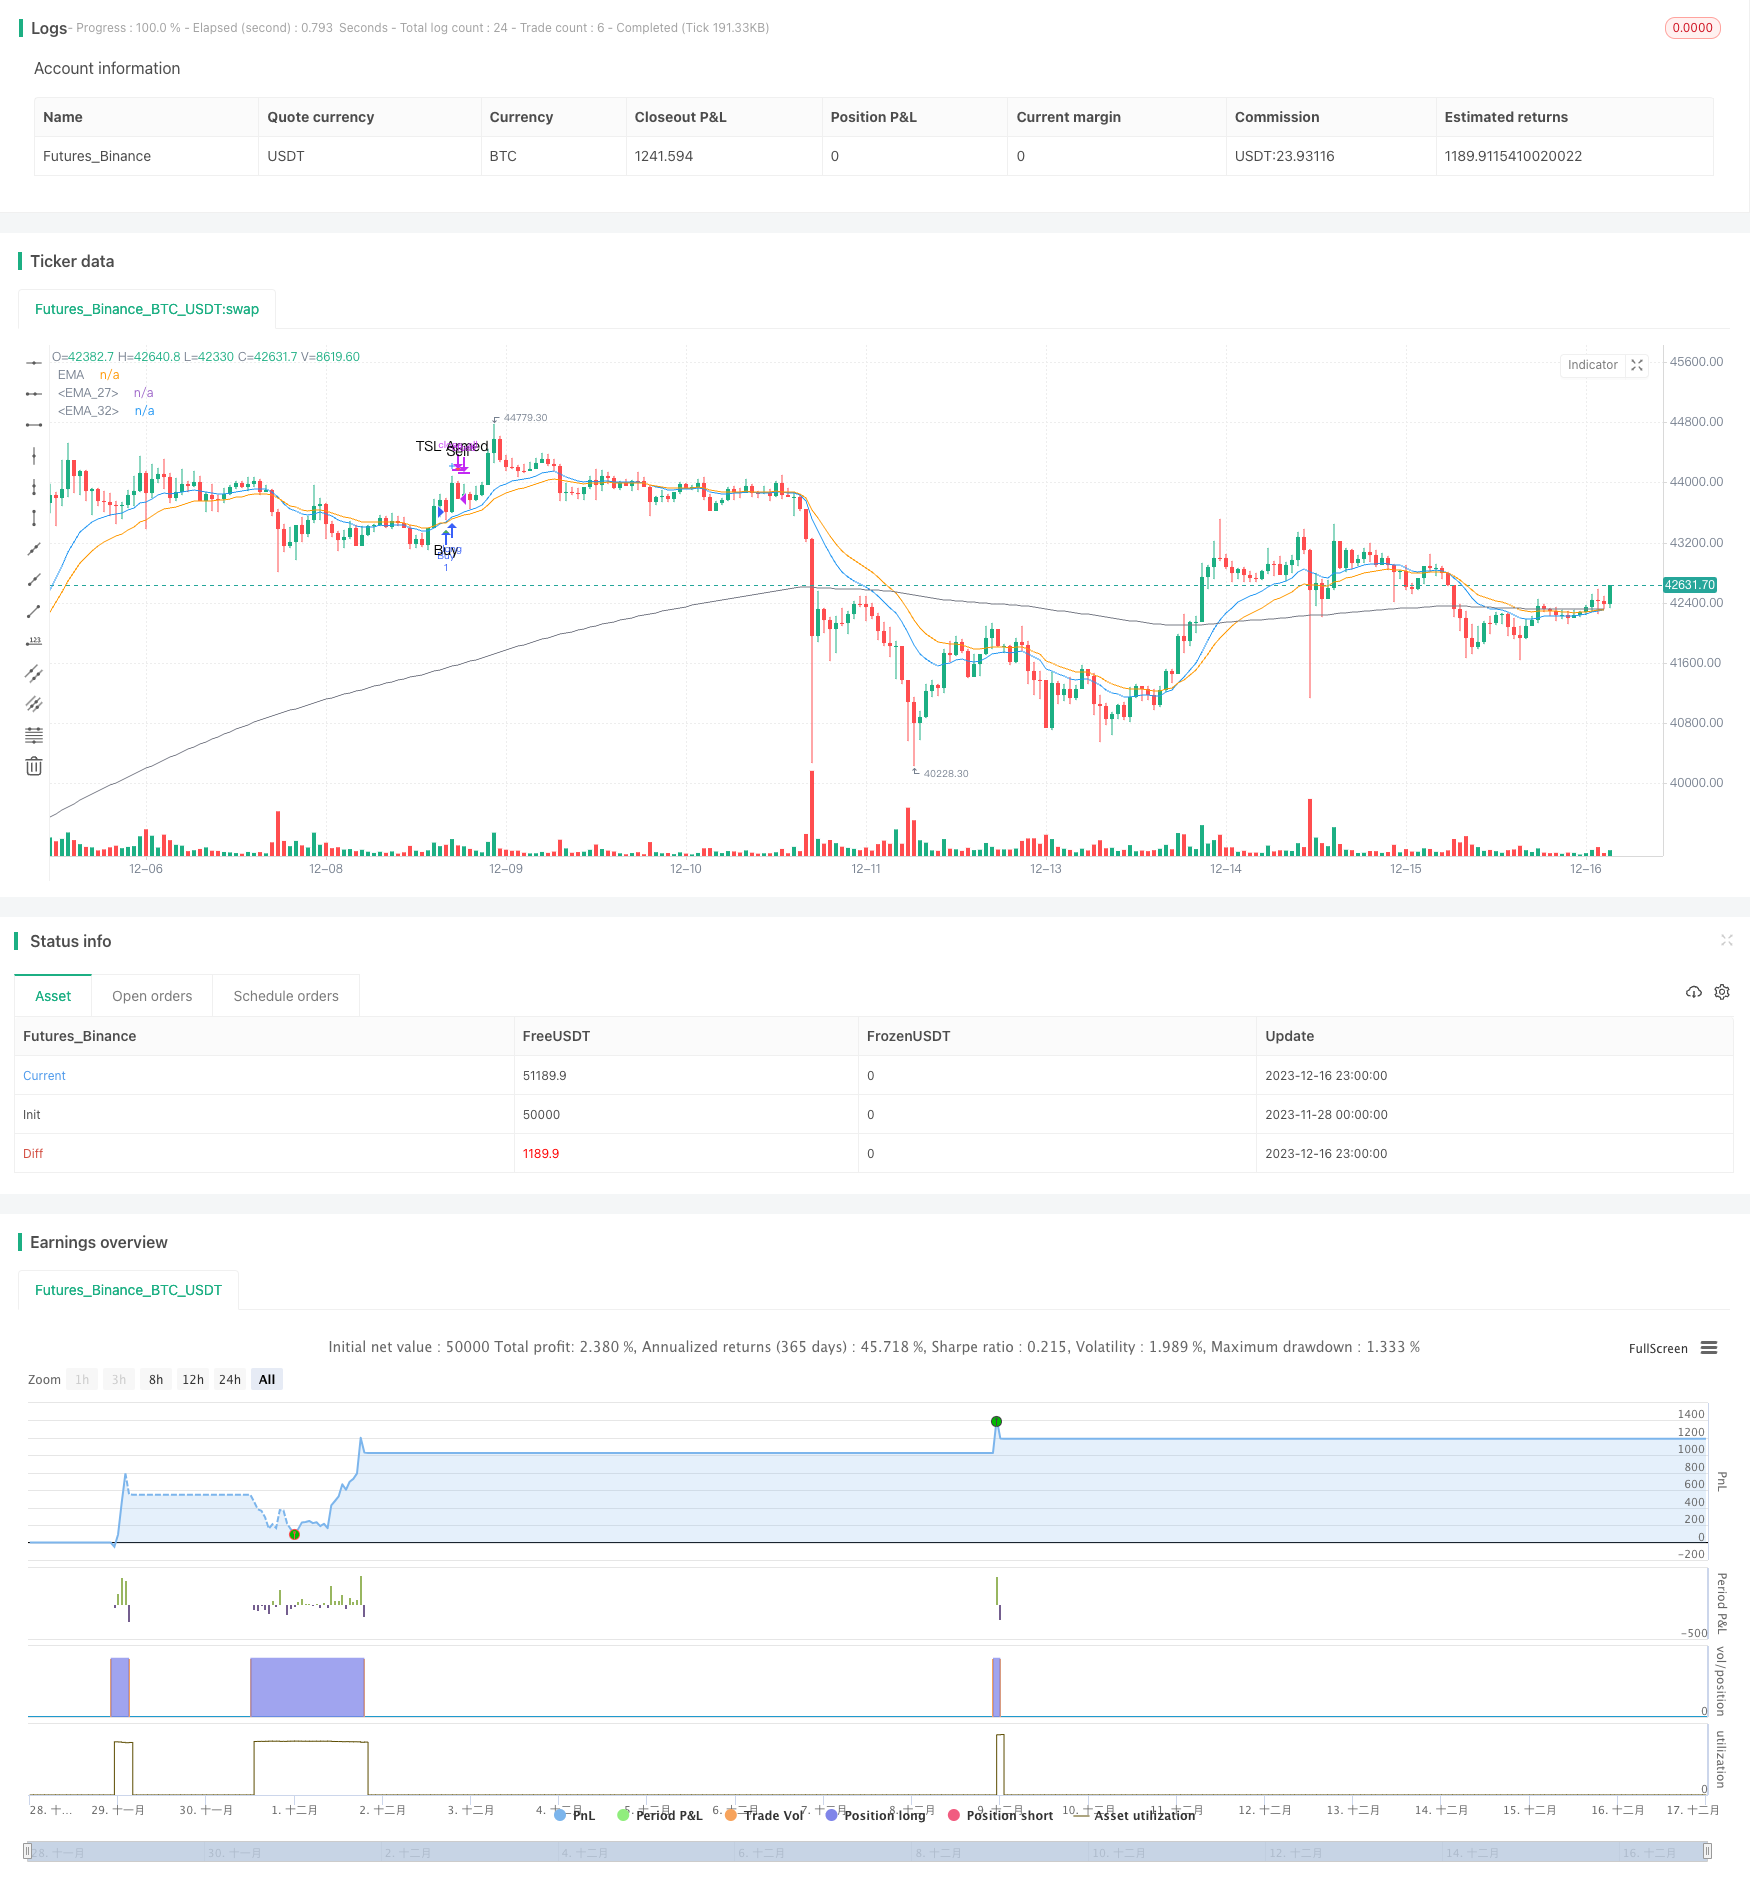
概述
动态追踪止损策略是一个利用追踪止损机制的量化交易策略。该策略基于趋势跟踪理论,设置追踪止损线,实现止损确认和追踪止损调整。主要用于控制单笔交易的止损,最大限度锁定盈利,降低交易风险。
策略原理
动态追踪止损策略的核心在于设定三个关键参数:初始止损距离、追踪止损距离和追踪止损触发距离。当买入信号触发后,根据买入价格和设定的初始止损距离计算出初始止损价。随后每根K线都会判断是否达到追踪止损触发条件,如果达到则会设置新的追踪止损价。新的追踪止损价会基于当前收盘价和追踪止损距离计算。这样,只要价格向有利方向运行,追踪止损线就会不断上调锁定盈利。当价格反转触发追踪止损线时,发出卖出信号。
该策略同时设有低位止损,无论是否启动追踪止损,如果价格跌破低位止损则会直接止损。低位止损用于防范突发事件的价格跳空。所以,动态追踪止损策略通过上下双线形式的动态止损机制,使止损线能够自动跟踪有利走势,同时防止损失过大。
策略优势
通过追踪止损不断锁定盈利,避免给回补过多机会。
采用上下双线止损结构,既确保止损线能及时跟进,又防止损失过大。
利用持续判断机制进行止损调整,操作简单,容易实现。
可根据市场和个股特点,调整参数优化止损效果。
无需预测市场走向,跟随趋势运行即可。
策略风险
参数设置不当可能导致止损过于宽松或过于紧迫。过于宽松则无法有效止损,过于紧迫则容易被价格普通波动击出。
突发事件造成价格跳空下跌时,可能导致止损无效,应配合其它防护措施。
交易费用和滑点可能对止损线触发后的实际卖出价格产生影响。
适应性并不强,在特定阶段,例如震荡区间中效果并不佳。
对策: 1. 建议根据回测和实盘结果不断优化参数。 2. 可设置更宽的低位止损防范跳空。 3. 计算止损价时考虑交易费用和滑点影响。 4. 可结合趋势和波动判断指标使用。
策略优化方向
将追踪止损线调整为百分比变化方式,可以更好跟踪不同价格水平下的股价变动。
添加波动率指标,判断大幅波动时暂停追踪止损,避免普通波动触发止损。
利用机器学习方法自动优化参数。训练样本选择最近一段时间内参数组合的收益率。
增加开仓条件判断,结合趋势、支持阻力等指标,避免在震荡行情开仓。
总结
动态追踪止损策略通过双线止损机制,设置追踪止损线,实现止损确认和追踪止损调整。可根据价格变化自动调整止损距离,用于锁定盈利、减少回吐和控制损失。该策略操作简单,易于实现,可根据市场情况优化参数,与其他策略组合使用效果更佳。但也存在一定局限性,建议调整完善后再投入实盘运用。
/*backtest
start: 2023-11-28 00:00:00
end: 2023-12-17 00:00:00
period: 1h
basePeriod: 15m
exchanges: [{"eid":"Futures_Binance","currency":"BTC_USDT"}]
*/

// This source code is subject to the terms of the Mozilla Public License 2.0 at https://mozilla.org/MPL/2.0/
// © Thumpyr
//@version=5

/////////////////////////////////////////////////////////////////////////////////////////////
// Comment out Strategy Line and remove // from Indicator line to turn into Indicator  //////
// Do same for alertConidction at bottom                                               //////
/////////////////////////////////////////////////////////////////////////////////////////////
strategy("PCT Trailing Stoploss-Strategy", shorttitle="PCT Trailing Stoploss- Strategy", overlay=true)
//indicator(title="PCT Trailing Stoploss- Indicator", shorttitle="PCT Trailing Stoploss - Indicator", timeframe="", timeframe_gaps=true, overlay=true)//

sellLow=input.float(.035, minval=0, title="Stop Loss Loss: 1% = .01", group="Sell Settings")
trailStopArm=input.float(.0065, minval=0, title="Trailing Stop Arm: 1%=.01", group="Sell Settings")
trailStopPct=input.float(.003, minval=0, title="Trailing Stop Trigger: 1%=.01 ", group="Sell Settings")

/////////////////////////////////////////////////
//               Indicators                    //
/////////////////////////////////////////////////
ema1Len = input.int(14, minval=1, title=" ema 1 Length", group="Trend Line Settings")
ema1Src = input(close, title="ema 1 Source", group="Trend Line Settings")
ema1 = ta.ema(ema1Src, ema1Len)
plot(ema1, title="EMA", color=color.blue)

ema2Len = input.int(22, minval=1, title=" ema 2 Length", group="Trend Line Settings")
ema2Src = input(close, title="ema 2 Source", group="Trend Line Settings")
ema2 = ta.ema(ema2Src, ema2Len)
plot(ema2, title="EMA", color=color.orange)

ema3Len = input.int(200, minval=1, title=" ema 3 Length", group="Trend Line Settings")
ema3Src = input(close, title="ema 2 Source", group="Trend Line Settings")
ema3 = ta.ema(ema3Src, ema3Len)
plot(ema3, title="EMA", color=color.gray)


/////////////////////////////
////   Buy Conditions    ////
/////////////////////////////

alertBuy = ta.crossover(ema1,ema2) and close>ema3

////////////////////////////////////////////////////////////////////
////   Filter redundant Buy Signals if Sell has not happened    ////
////////////////////////////////////////////////////////////////////
var lastsignal = 0
showAlertBuy = 0
if(alertBuy and lastsignal !=1)
    showAlertBuy  := 1
    lastsignal      := 1
buyAlert= showAlertBuy > 0


//////////////////////////////////////////////////////////////////
////          Track Conditions at buy Signal                  ////
//////////////////////////////////////////////////////////////////

alertBuyValue = ta.valuewhen(buyAlert, close,0)
alertSellValueLow = alertBuyValue - (alertBuyValue*sellLow)

////////////////////////////////////////////////////////////
/////            Trailing Stop                         /////
////////////////////////////////////////////////////////////
var TSLActive=0         //Check to see if TSL has been activated
var TSLTriggerValue=0.0 //Initial and climbing value of TSL
var TSLStop = 0.0       //Sell Trigger
var TSLRunning =0       //Continuously check each bar to raise TSL or not

//  Check if a Buy has been triggered and set initial value for TSL //
if buyAlert
    TSLTriggerValue := alertBuyValue+(alertBuyValue*trailStopArm)
    TSLActive := 0
    TSLRunning :=1
    TSLStop := TSLTriggerValue - (TSLTriggerValue*trailStopPct)


//  Check that Buy has triggered and if Close has reached initial TSL//
//  Keeps from setting Sell Signal before TSL has been armed w/TSLActive//
beginTrail=TSLRunning==1 and TSLActive==0 and close>alertBuyValue+(alertBuyValue*trailStopArm) and ta.crossover(close,TSLTriggerValue)
if beginTrail
    TSLTriggerValue :=close
    TSLActive :=1
    TSLStop :=TSLTriggerValue - (TSLTriggerValue*trailStopPct)

//  Continuously check if TSL needs to increase and set new value //
runTrail= TSLActive==1 and (ta.crossover(close,TSLTriggerValue) or close>=TSLTriggerValue)
if runTrail
    TSLTriggerValue :=close
    TSLStop :=TSLTriggerValue - (TSLTriggerValue*trailStopPct)

//  Verify that TSL is active and trigger when close cross below TSL Stop//
TSL=TSLActive==1 and (ta.crossunder(close,TSLStop) or (close[1]>TSLStop and close<TSLStop))

// Plot point of inital arming of TSL//
TSLTrigger=TSLActive==1 and TSLActive[1]==0
plotshape(TSLTrigger, title='TSL Armed', location=location.abovebar, color=color.new(color.blue, 0), size=size.small, style=shape.cross, text='TSL Armed')


////////////////////////////////////////////////////////////
// Plots used for troubleshooting and verification of TSL //
////////////////////////////////////////////////////////////
//plot(TSLActive,"Trailing Stop", color=#f48fb1)
//plot(TSLRunning,"Trailing Stop", color=#f48fb1)
//plot(TSLTriggerValue,"Trailing Stop Trigger", color.new(color=#ec407a, transp = TSLRunning==1 ? 0 : 100))
//plot(TSLStop,"Trailing Stop", color.new(color=#f48fb1, transp = TSLRunning==1 ? 0 : 100))//


////////////////////////////////////////////////////////////
/////             Sell Conditions                    ///////
////////////////////////////////////////////////////////////
Sell1 = TSL
Sell2 = ta.crossunder(close,alertSellValueLow)

alertSell= Sell1 or Sell2
////////////////////////////////////////////////////////////

////////////////////////////////////////////////////////////
////        Remove Redundant Signals                    ////
////////////////////////////////////////////////////////////
showAlertSell = 0
if(alertSell and lastsignal != -1)
    showAlertSell := 1
    lastsignal      := -1
sellAlert= showAlertSell > 0

if sellAlert
    TSLActive :=0
    TSLRunning :=0

/////////////////////////////////////////
//  Plot Buy and Sell Shapes on Chart  //
/////////////////////////////////////////
plotshape(buyAlert, title='Buy', location=location.belowbar, color=color.new(color.green, 0), size=size.small, style=shape.triangleup, text='Buy')
plotshape(sellAlert, title='Sell', location=location.abovebar, color=color.new(color.red, 0), size=size.small, style=shape.triangledown, text='Sell')

/////////////////////////////////////////////////////////////////////////////////////////////
//                        Remove // to setup for Indicator                                 //
/////////////////////////////////////////////////////////////////////////////////////////////
//Alerts
//alertcondition(title='Buy Alert', condition=buyAlert, message='Buy Conditions are Met')
//alertcondition(title='Sell Alert', condition=sellAlert, message='Sell Conditions are Met')
/////////////////////////////////////////////////////////////////////////////////////////////


////////////////////////////////////////////////////////////
////  Comment out this section if setup as Indicator    ////
////////////////////////////////////////////////////////////
longCondition = buyAlert
if (longCondition)
    strategy.entry("Buy", strategy.long)
    alert(message='Buy', freq=alert.freq_once_per_bar_close)

shortCondition = sellAlert
if (shortCondition)
    strategy.close_all(sellAlert,"Sell")
    alert(message='Sell', freq=alert.freq_once_per_bar_close)
/////////////////////////////////////////////////////////////