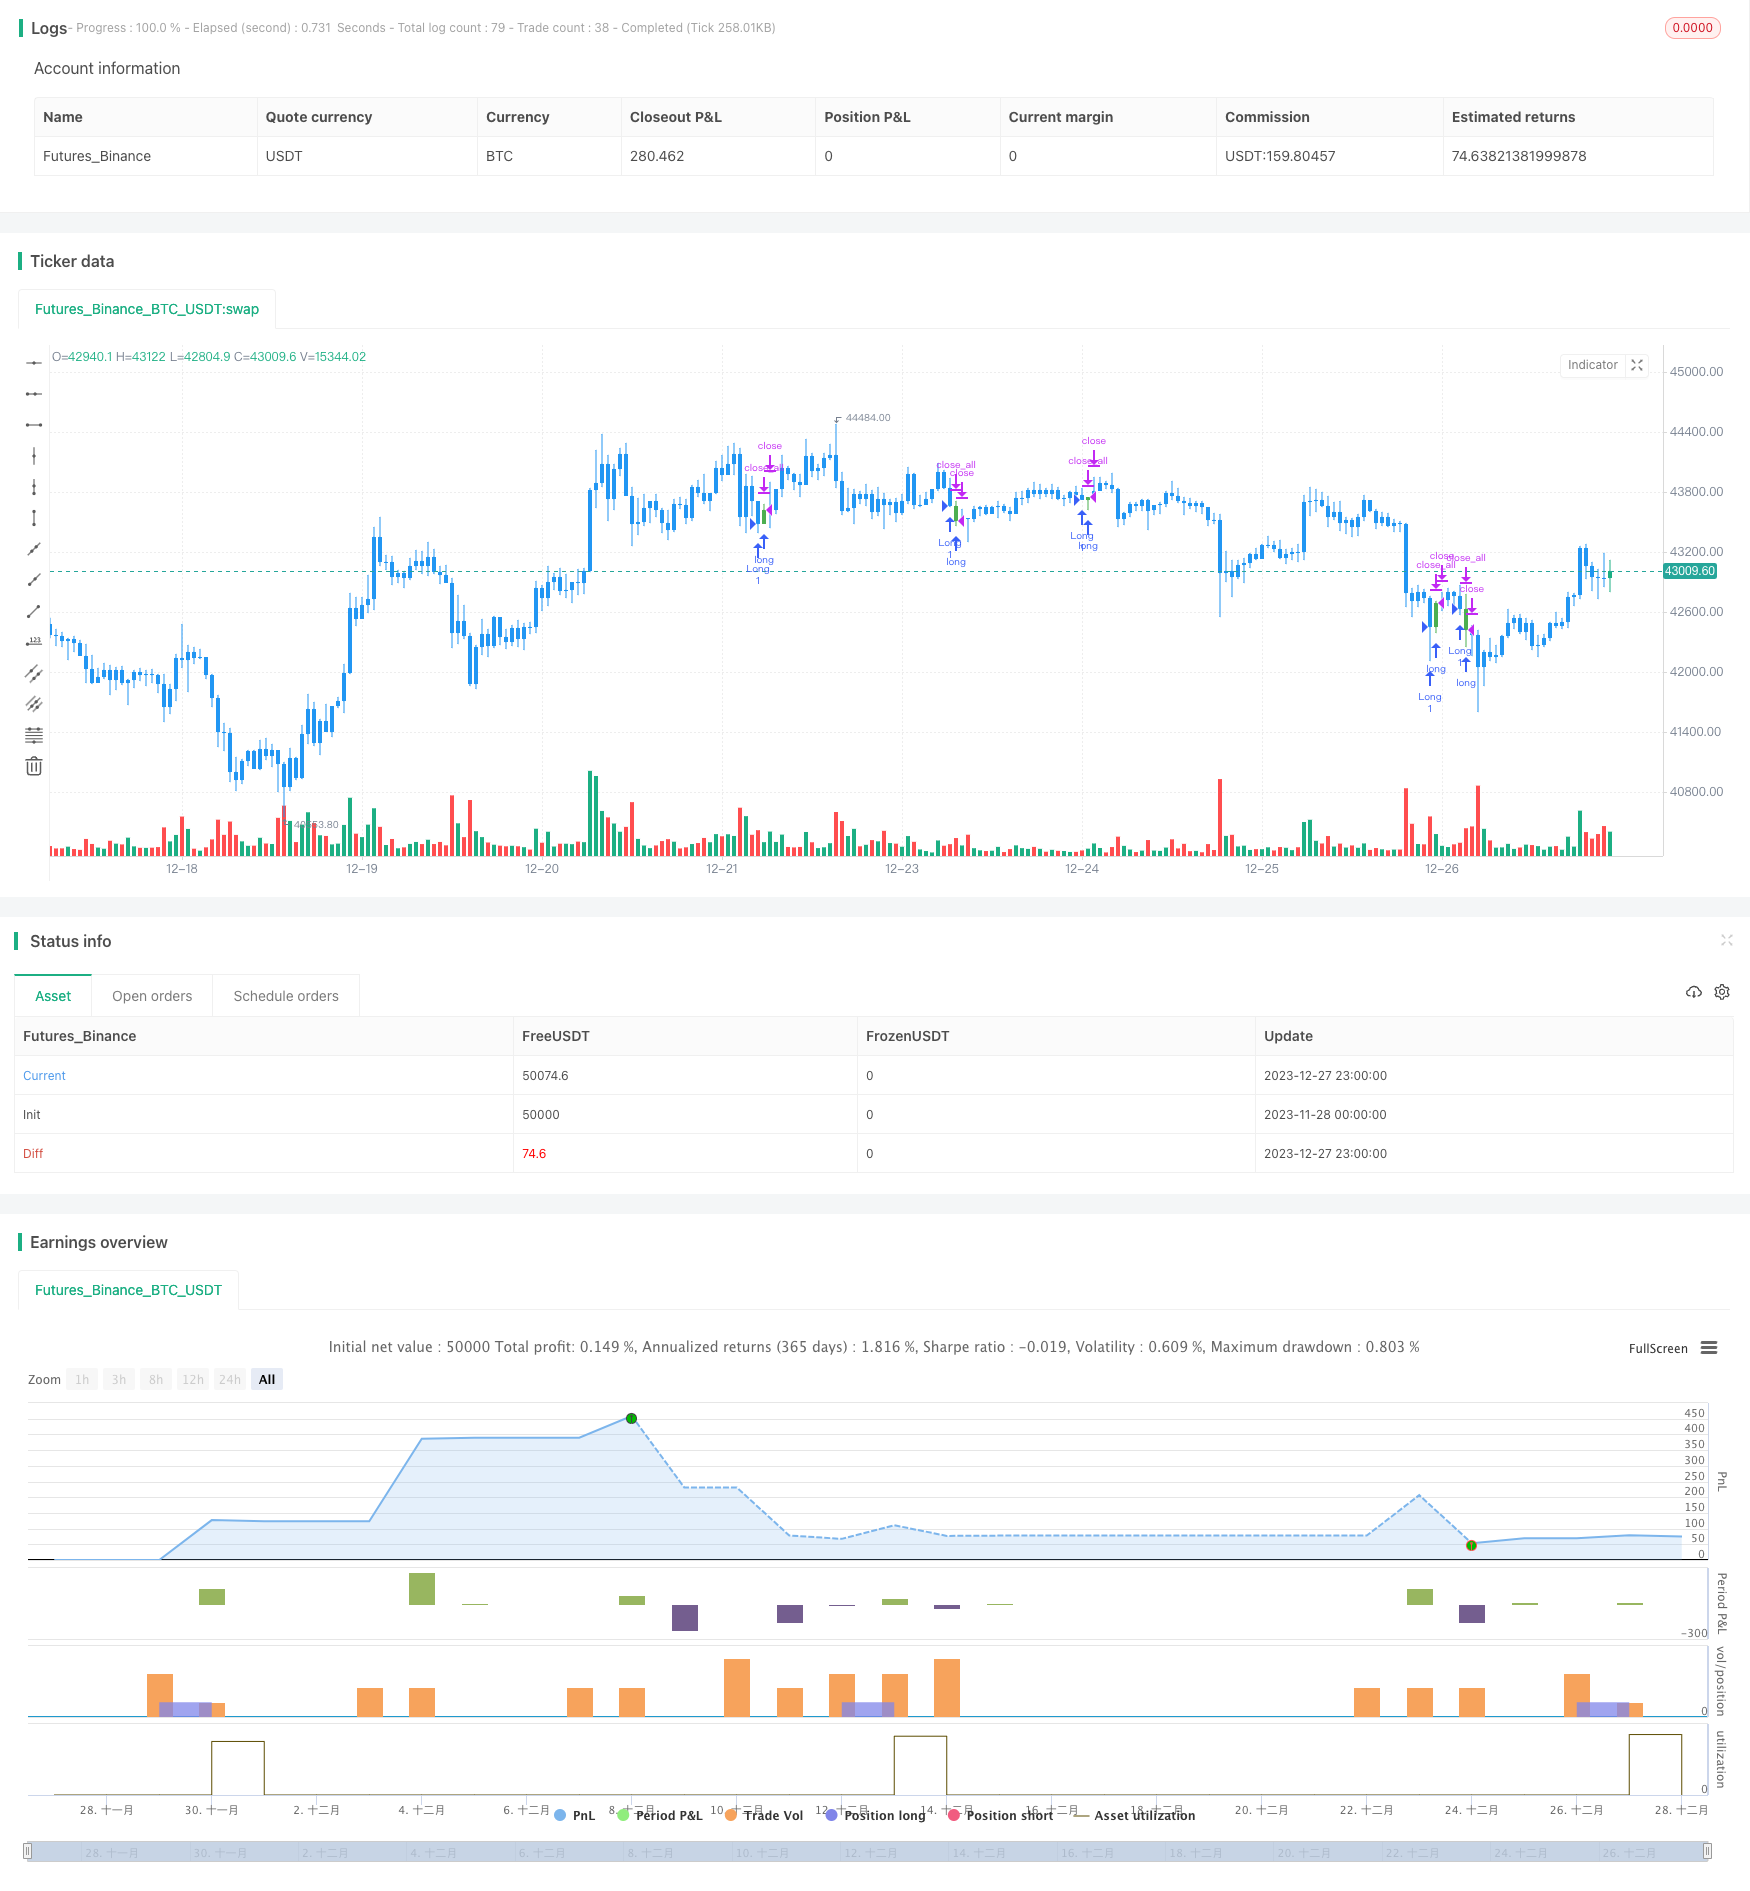
The Three Inside Down Reversal strategy is a technical analysis strategy that identifies reversal signals in stock prices. It consists of three candlesticks, starting with a bullish candle with a long upper shadow, followed by a bearish candle that completely engulfs the body of the previous one, and completed with a third candle whose opening price is below the previous closing price. This indicates that after rising, the price encountered strong selling pressure at this level, signaling a possible downward reversal.
The judgment rules of the Three Inside Down Reversal strategy are:
Candlestick 1: A bullish candle with a relatively long upper shadow, which means a large difference between its highest price and opening price compared to its real body.
Candlestick 2: A bearish candle that completely engulfs the real body of the previous candle, with its lowest price below that of candlestick 1.
Candlestick 3: Its opening price is lower than the closing price of candlestick 2, and its closing price is also lower than the lowest price of candlestick 2.
When the above three conditions are met, it indicates that strong selling pressure has emerged during an upward price movement, and a downward reversal may occur. The strategy will then open a long position at the opening price of candlestick 3, with a stop loss and take profit set. The specific logic for entry, stop loss and take profit is:
Entry Logic: Open long position at the opening price of candlestick 3 when the above rules are met.
Stop Loss Logic: Close long position for stop loss when price falls to stop loss level.
Take Profit Logic:
Close long position for profit when price rises to take profit level.
The main advantages of the Three Inside Down Reversal strategy are:
Clear trading signals that are easy to judge. The pattern features of Three Inside Down are very obvious and easy to identify, avoiding missing trades.
Relatively high success rate. This price pattern often signifies a change in market sentiment and mainstream direction, leading to a high success rate for opening positions.
Controllable risk. There is a clear stop loss logic that limits single loss within a range, avoiding account blowups.
Strong adaptability. It is applicable to most varieties and timeframes, and works especially well for medium and short-term trading.
There are also some risks in the Three Inside Down Reversal strategy:
Potential stop loss being triggered. There is still a chance of failure for reversal signals, which would trigger the stop loss.
Time limitation risk. If the reversal process lasts too long, there will be higher capital costs.
Risk from parameter setting. Stop loss and take profit settings impact actual P&L, requiring prudent evaluation.
Risk from frequent trading. Higher trade count leads to increased transaction costs and psychological pressure.
The Three Inside Down Reversal strategy can be optimized from the following aspects:
Combine with trading volume indicators. Adding volume criteria avoids false signals.
Adjust parameter settings. Evaluate optimal stop loss and take profit parameters across different products and timeframes.
Add filter conditions. Incorporate other indicators to avoid invalid trades during consolidation periods.
Optimize entry timing. Assess price action after opening of the third candlestick and find better entry points.
The Three Inside Down Reversal strategy aims to open positions during the initial stage of potential price reversals by identifying candlestick patterns representing the emergence of selling pressure interrupting an upward price movement. This is a risk-controllable, simple and practical technical analysis strategy that is essential in the toolbox of quantitative trading. It has the advantage of efficiently spotting trading signals and having clear trading rules, but also needs to pay attention to risks like stop loss and holding periods during practical implementation. Further evaluations and optimizations of the strategy parameters can lead to better strategy performance.
/*backtest start: 2023-11-28 00:00:00 end: 2023-12-28 00:00:00 period: 1h basePeriod: 15m exchanges: [{"eid":"Futures_Binance","currency":"BTC_USDT"}] */ //@version=3 //////////////////////////////////////////////////////////// // Copyright by HPotter v1.0 06/02/2019 // This is a three candlestick bearish reversal pattern consisting of a bearish // harami pattern formed by the first 2 candlesticks then followed by down // candlestick with a lower close than the prior candlestick. // WARNING: // - For purpose educate only // - This script to change bars colors. //////////////////////////////////////////////////////////// strategy(title = "Three Inside Down Backtest", overlay = true) input_takeprofit = input(40, title="Take Profit pip", step=0.01) input_stoploss = input(20, title="Stop Loss pip", step=0.01) barcolor(close[2] > open[2] ? open[1] > close[1] ? open[1] <= close[2] ? open[2] <= close[1] ? open[1] - close[1]< close[2] - open[2] ? close < open ? close < close[1] ? open < open[1] ? close < open[2] ? yellow :na :na : na : na : na:na : na : na : na) posprice = 0.0 pos = 0.0 barcolor(nz(pos[1], 0) == -1 ? red: nz(pos[1], 0) == 1 ? green : blue ) posprice := close[2] > open[2] ? open[1] > close[1] ? open[1] <= close[2] ? open[2] <= close[1] ? open[1] - close[1]< close[2] - open[2] ? close < open ? close < close[1] ? open < open[1] ? close < open[2] ? close :nz(posprice[1], 0) :nz(posprice[1], 0) : nz(posprice[1], 0) : nz(posprice[1], 0) :nz(posprice[1], 0):nz(posprice[1], 0):nz(posprice[1], 0):nz(posprice[1], 0):nz(posprice[1], 0) pos := iff(posprice > 0, 1, 0) if (pos == 0) strategy.close_all() if (pos == 1) strategy.entry("Long", strategy.long) posprice := iff(high >= posprice + input_takeprofit and posprice > 0, 0 , nz(posprice, 0)) posprice := iff(low <= posprice - input_stoploss and posprice > 0, 0 , nz(posprice, 0))template: strategy.tpl:40:21: executing "strategy.tpl" at <.api.GetStrategyListByName>: wrong number of args for GetStrategyListByName: want 7 got 6