概述
本策略采用线性回归技术计算出线性回归拦截点,并以其作为买卖信号来构建量化交易策略。该策略通过分析股票价格时间序列,拟合一条线性回归趋势线,使用线性回归拦截点判断价格是否被高估或低估,以此产生交易信号。
策略原理
线性回归拦截点表示当时间系列X值为0时,Y值(通常是价格)的预测值。该策略预先设置参数Length,以收盘价为源序列,计算出最近Length天的线性回归拦截点(xLRI)。当收盘价高于xLRI时,做多;当收盘价低于xLRI时,做空。
具体计算公式如下:
xX = Length *(Length - 1)* 0.5
xDivisor = xX *xX - Length* Length *(Length - 1) *(2 * Length - 1) / 6
xXY = Σ(i *收盘价[i]),i从0到Length-1
xSlope = (Length *xXY - xX* Σ(收盘价, Length))/ xDivisor
xLRI = (Σ(收盘价, Length) - xSlope * xX) / Length
通过这样的计算,可以得到最近Length天的线性回归拦截点xLRI。策略以其判断价格的高低,产生交易信号。
策略优势
本策略具有以下优势:
- 采用线性回归技术,对价格具有一定的预测能力和趋势判断能力。
- 参数较少,模型简单,容易理解和实现。
- 可自定义参数Length adaptive 调整策略灵活性。
风险及解决方法
本策略也存在一些风险:
- 线性回归拟合仅仅是基于历史数据进行的统计拟合,对未来价格走势的预测能力有限。
- 如果公司基本面发生较大变化,线性回归拟合的结果可能会失效。
- 参数Length设置不当可能导致过拟合。
对策:
- 适当缩短参数Length,防止过拟合。
- 关注公司基本面变化,必要时人工干预关闭仓位。
- 采用自适应参数Length,根据市场情况动态调整。
策略优化方向
本策略还可从以下方面进行优化:
- 增加止损机制,以控制单笔损失。
- 结合其它指标,形成组合策略,提高稳定性。
- 增加参数自适应优化模块,让Length参数动态变化。
- 增加仓位控制模块,防止超量交易。
总结
本策略基于线性回归拦截点构建了一个简单的量化交易策略。总体来说,该策略具有一定的经济价值,但也存在一些风险需要注意。通过不断优化,有望进一步提高策略的稳定性和收益性。
策略源码
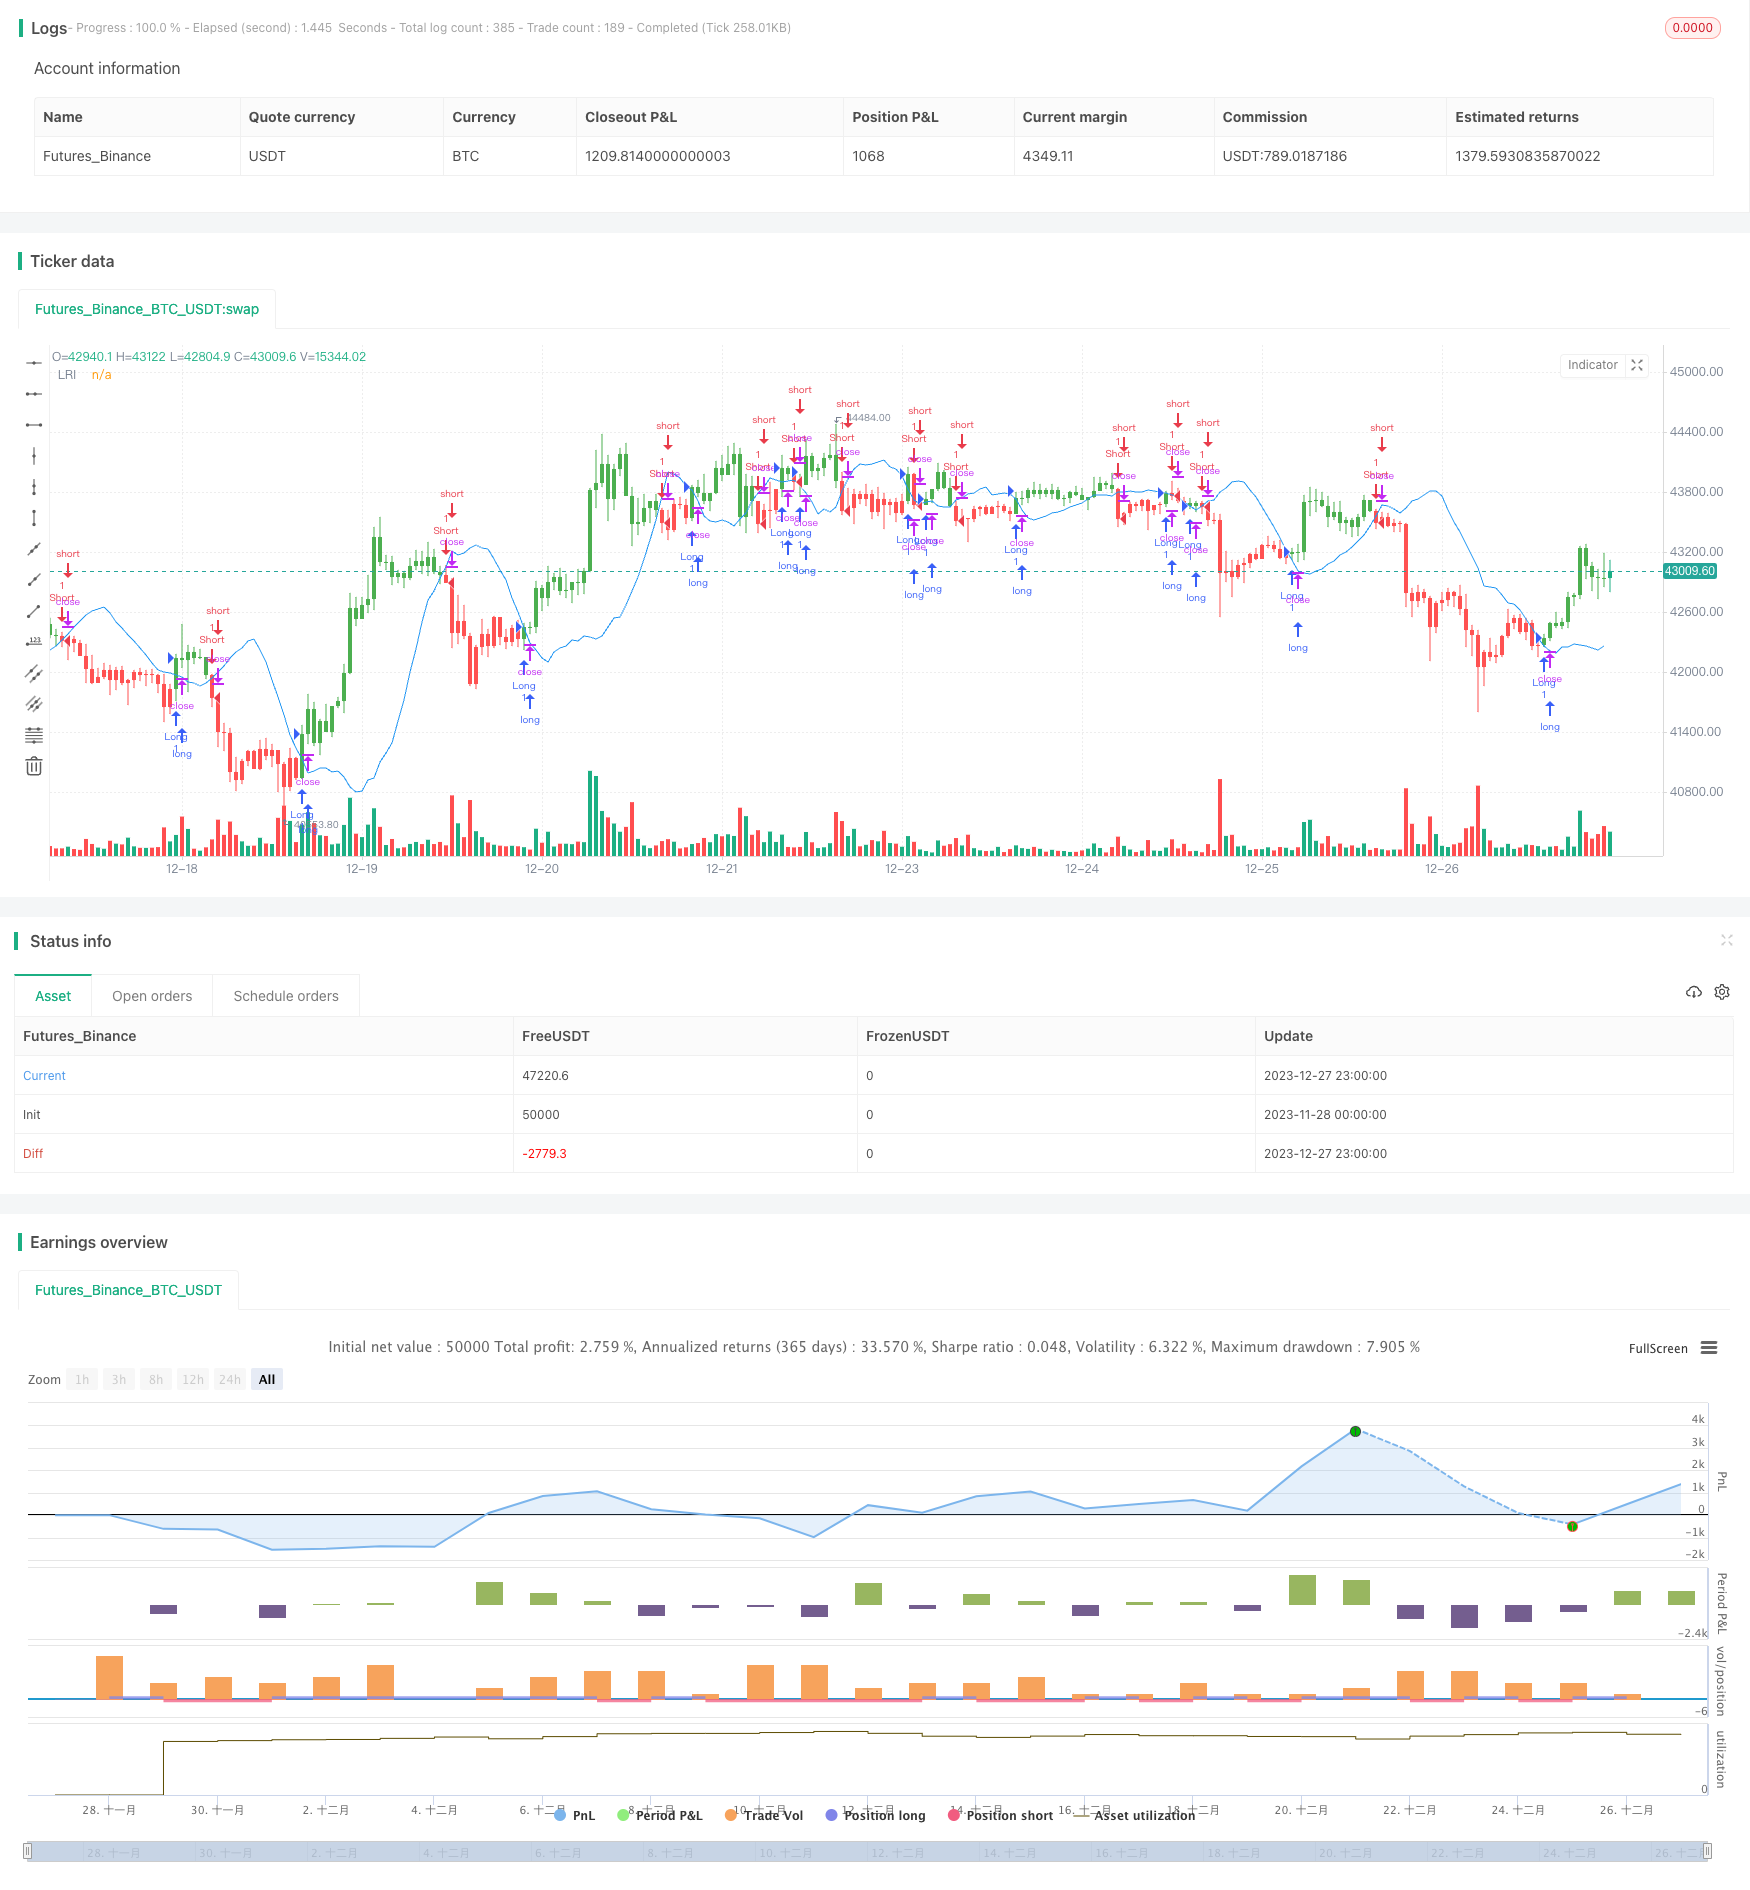
/*backtest
start: 2023-11-28 00:00:00
end: 2023-12-28 00:00:00
period: 1h
basePeriod: 15m
exchanges: [{"eid":"Futures_Binance","currency":"BTC_USDT"}]
*/

//@version=2
////////////////////////////////////////////////////////////
//  Copyright by HPotter v1.0 21/03/2018
// Linear Regression Intercept is one of the indicators calculated by using the
// Linear Regression technique. Linear regression indicates the value of the Y
// (generally the price) when the value of X (the time series) is 0. Linear
// Regression Intercept is used along with the Linear Regression Slope to create
// the Linear Regression Line. The Linear Regression Intercept along with the Slope
// creates the Regression line.
//
// You can change long to short in the Input Settings
// WARNING:
//  - For purpose educate only
//  - This script to change bars colors.
////////////////////////////////////////////////////////////
strategy(title="Line Regression Intercept Backtest", overlay = true)
Length = input(14, minval=1)
xSeria = input(title="Source", defval=close)
reverse = input(false, title="Trade reverse")
xX = Length * (Length - 1) * 0.5
xDivisor = xX * xX - Length * Length * (Length - 1) * (2 * Length - 1) / 6
xXY = 0
for i = 0 to Length-1
	xXY := xXY + (i * xSeria[i])
xSlope = (Length * xXY - xX * sum(xSeria, Length)) / xDivisor
xLRI = (sum(xSeria, Length) - xSlope * xX) / Length
pos = iff(close > xLRI, 1,
       iff(close < xLRI, -1, nz(pos[1], 0)))
possig = iff(reverse and pos == 1, -1,
          iff(reverse and pos == -1, 1, pos))
if (possig == 1)
    strategy.entry("Long", strategy.long)
if (possig == -1)
    strategy.entry("Short", strategy.short)
barcolor(possig == -1 ? red: possig == 1 ? green : blue )
plot(xLRI, color=blue, title="LRI")