VWAP-RSI Oversold Crossunder BTC Short Strategy

Author: ChaoZhang, Date: 2023-12-29 14:12:54
Tags:

img

Overview

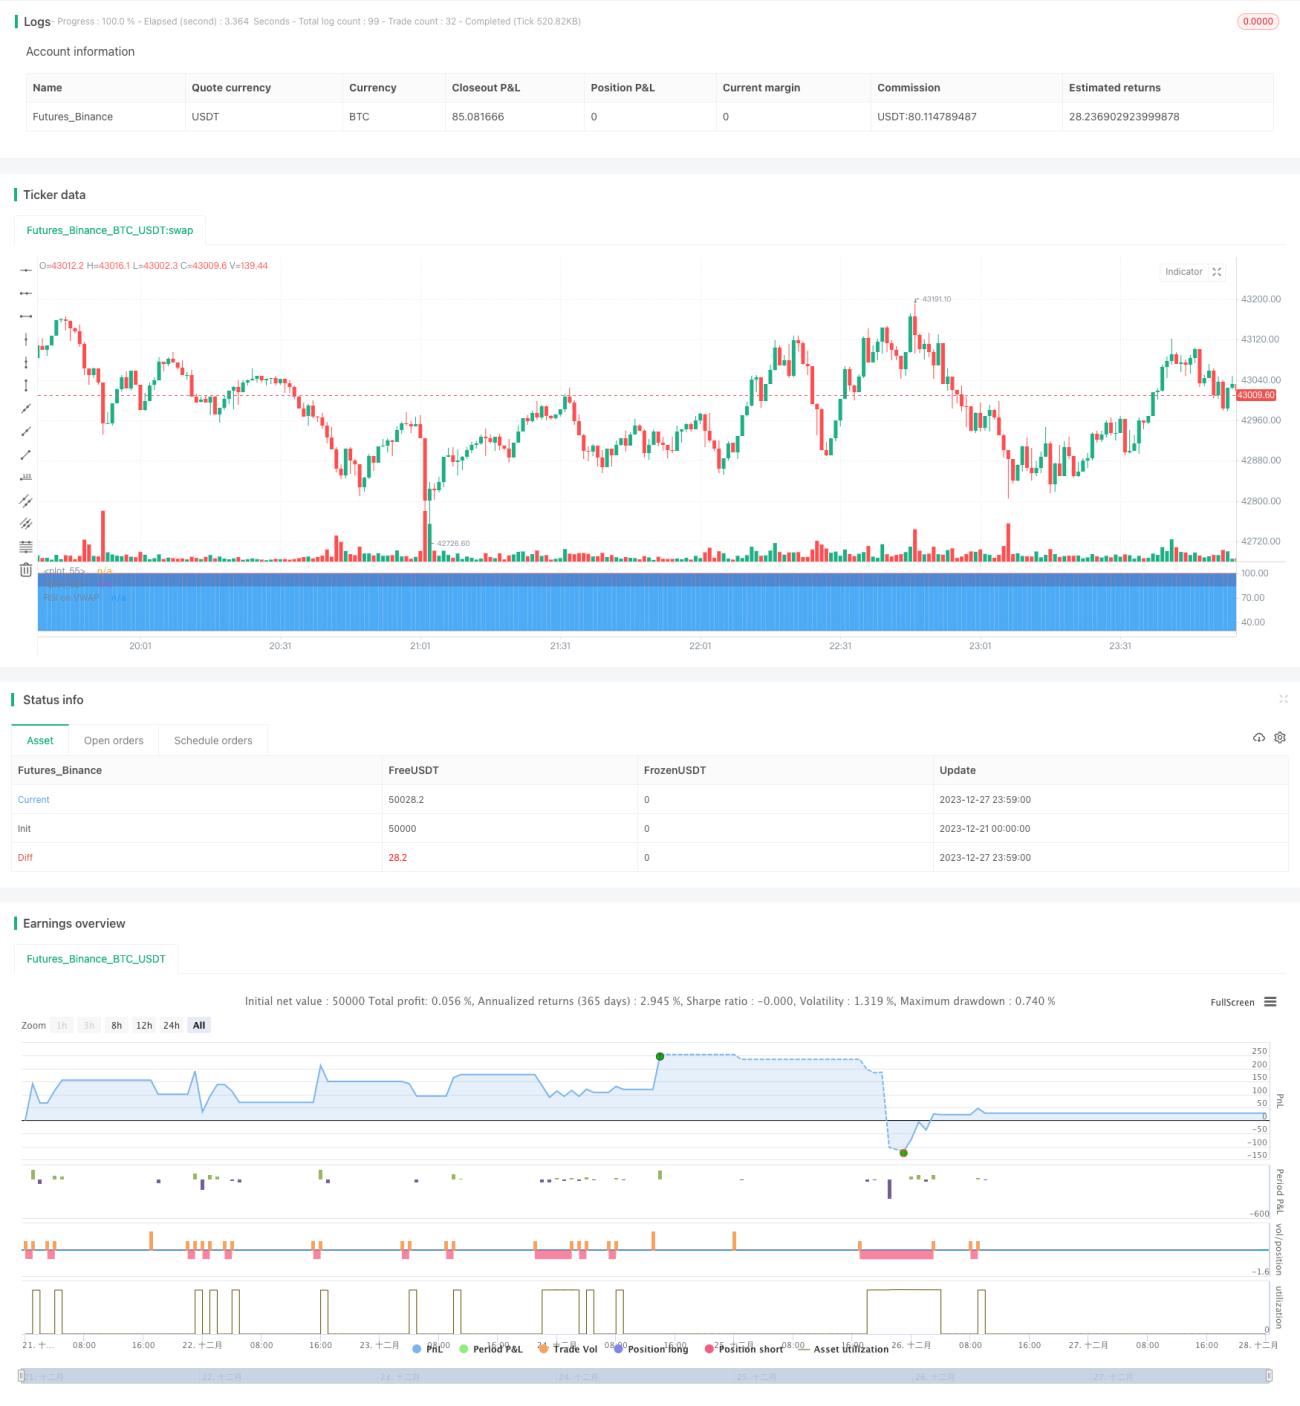
This is a BTC short strategy across timeframes based on the RSI indicator of VWAP. It calculates the Volume Weighted Average Price (VWAP) of each candlestick to get a VWAP curve, and then applies the RSI indicator to the curve. When the RSI indicator crosses down from the overbought zone, it goes short on BTC.

Strategy Logic

  1. Calculate VWAP of each candlestick to get a VWAP curve
  2. Apply RSI indicator to VWAP curve, with length of 20 days, overbought level at 85 and oversold level at 30
  3. When RSI crosses down from overbought zone (85) to oversold zone (30), open short position
  4. Close position after holding for 28 candlesticks, or if RSI crosses oversold line (30) again

Advantage Analysis

  1. Use VWAP instead of simple close price to reflect actual trading price
  2. Identify overbought/oversold status with RSI to avoid buying high and selling low
  3. Trade across timeframes to avoid being trapped
  4. Controllable risk with 28 candlesticks stop loss

Risks & Solutions

  1. Price surges rapidly due to black swan events, unable to stop loss
    • Adopt across timeframes trading to reduce risks of being trapped
  2. Inappropriate parameter settings, easily miss opportunities
    • Test and optimize RSI parameters and overbought/oversold levels
  3. RSI unable to cross into oversold zone
    • Combine with other indicators to determine trend, adjust parameters flexibly

Optimization Directions

  1. Test more parameter combinations to find optimum
  2. Combine with MACD, KD etc to judge overbought/oversold status
  3. Test parameter settings separately for different assets
  4. Optimize stop loss mechanism, set stop loss range based on volatility

Summary

This strategy identifies BTC overbought/oversold status with the combination of VWAP and RSI. By trading across timeframes, it can effectively control risks. The strategy logic is clear and easy to understand, worth further testing and optimizing for live trading.


/*backtest
start: 2023-12-21 00:00:00
end: 2023-12-28 00:00:00
period: 1m
basePeriod: 1m
exchanges: [{"eid":"Futures_Binance","currency":"BTC_USDT"}]
*/


//@version=4

strategy("Soran Strategy 2 - SHORT SIGNALS", pyramiding=1, initial_capital=1000, default_qty_type=strategy.percent_of_equity, default_qty_value=50, overlay=false)


// ----------------- Inputs ----------------- //

reso = input(title="Resolution", type=input.resolution, defval="")
length = input(20, title="RSI Length", type=input.integer)
ovrsld = input(30, "RSI Oversold level", type=input.float)
ovrbgt = input(85, "RSI Overbought level", type=input.float)
lateleave = input(28, "Number of candles", type=input.integer)
// lateleave : numbers of bars in overbought/oversold zones where the position is closed. The position is closed when this number is reached or when the zone is left (the first condition).

// best parameters BTCUSDTPERP M15 : 20 / 30 / 85 / 28


stratbull = input(title="Enter longs ?", type = input.bool, defval=true)
stratbear = input(title="Enter shorts ?", type = input.bool, defval=true)

stratyear = input(2020, title = "Strategy Start Year")
stratmonth = input(1, title = "Strategy Start Month")
stratday = input(1, title = "Strategy Start Day")
stratstart = timestamp(stratyear,stratmonth,stratday,0,0)


// --------------- Laguerre ----------------- //

laguerre = input(title="Use Laguerre on RSI ?", type=input.bool, defval=false)
gamma = input(0.06, title="Laguerre Gamma")

laguerre_cal(s,g) =>
    l0 = 0.0
    l1 = 0.0
    l2 = 0.0
    l3 = 0.0
    l0 := (1 - g)*s+g*nz(l0[1])
    l1 := -g*l0+nz(l0[1])+g*nz(l1[1])
    l2 := -g*l1+nz(l1[1])+g*nz(l2[1])
    l3 := -g*l2+nz(l2[1])+g*nz(l3[1])
    (l0 + 2*l1 + 2*l2 + l3)/6


// ---------------- Rsi VWAP ---------------- //

rsiV = security(syminfo.tickerid, reso, rsi(vwap(close), length))

rsiVWAP = laguerre ? laguerre_cal(rsiV,gamma) : rsiV


// ------------------ Plots ----------------- //

prsi = plot(rsiVWAP, color = rsiVWAP>ovrbgt ? color.red : rsiVWAP<ovrsld ? color.green : color.white, title="RSI on VWAP", linewidth=1, style=plot.style_line)
hline = plot(ovrbgt, color = color.gray, style=plot.style_line)
lline = plot(ovrsld, color = color.gray, style=plot.style_line)
fill(prsi,hline, color = rsiVWAP > ovrbgt ? color.red : na, transp = 30)
fill(prsi,lline, color = rsiVWAP < ovrsld ? color.green : na, transp = 30)


// ---------------- Positions: only shows the Short and close shoret positions --------------- //

timebull = stratbull and time > stratstart
timebear = stratbear and time > stratstart


strategy.entry("Short", false, when = timebear and crossunder(rsiVWAP, ovrbgt), comment="")
strategy.close("Short", when = timebear and crossunder(rsiVWAP, ovrsld)[lateleave] or crossover(rsiVWAP, ovrsld), comment="")

More