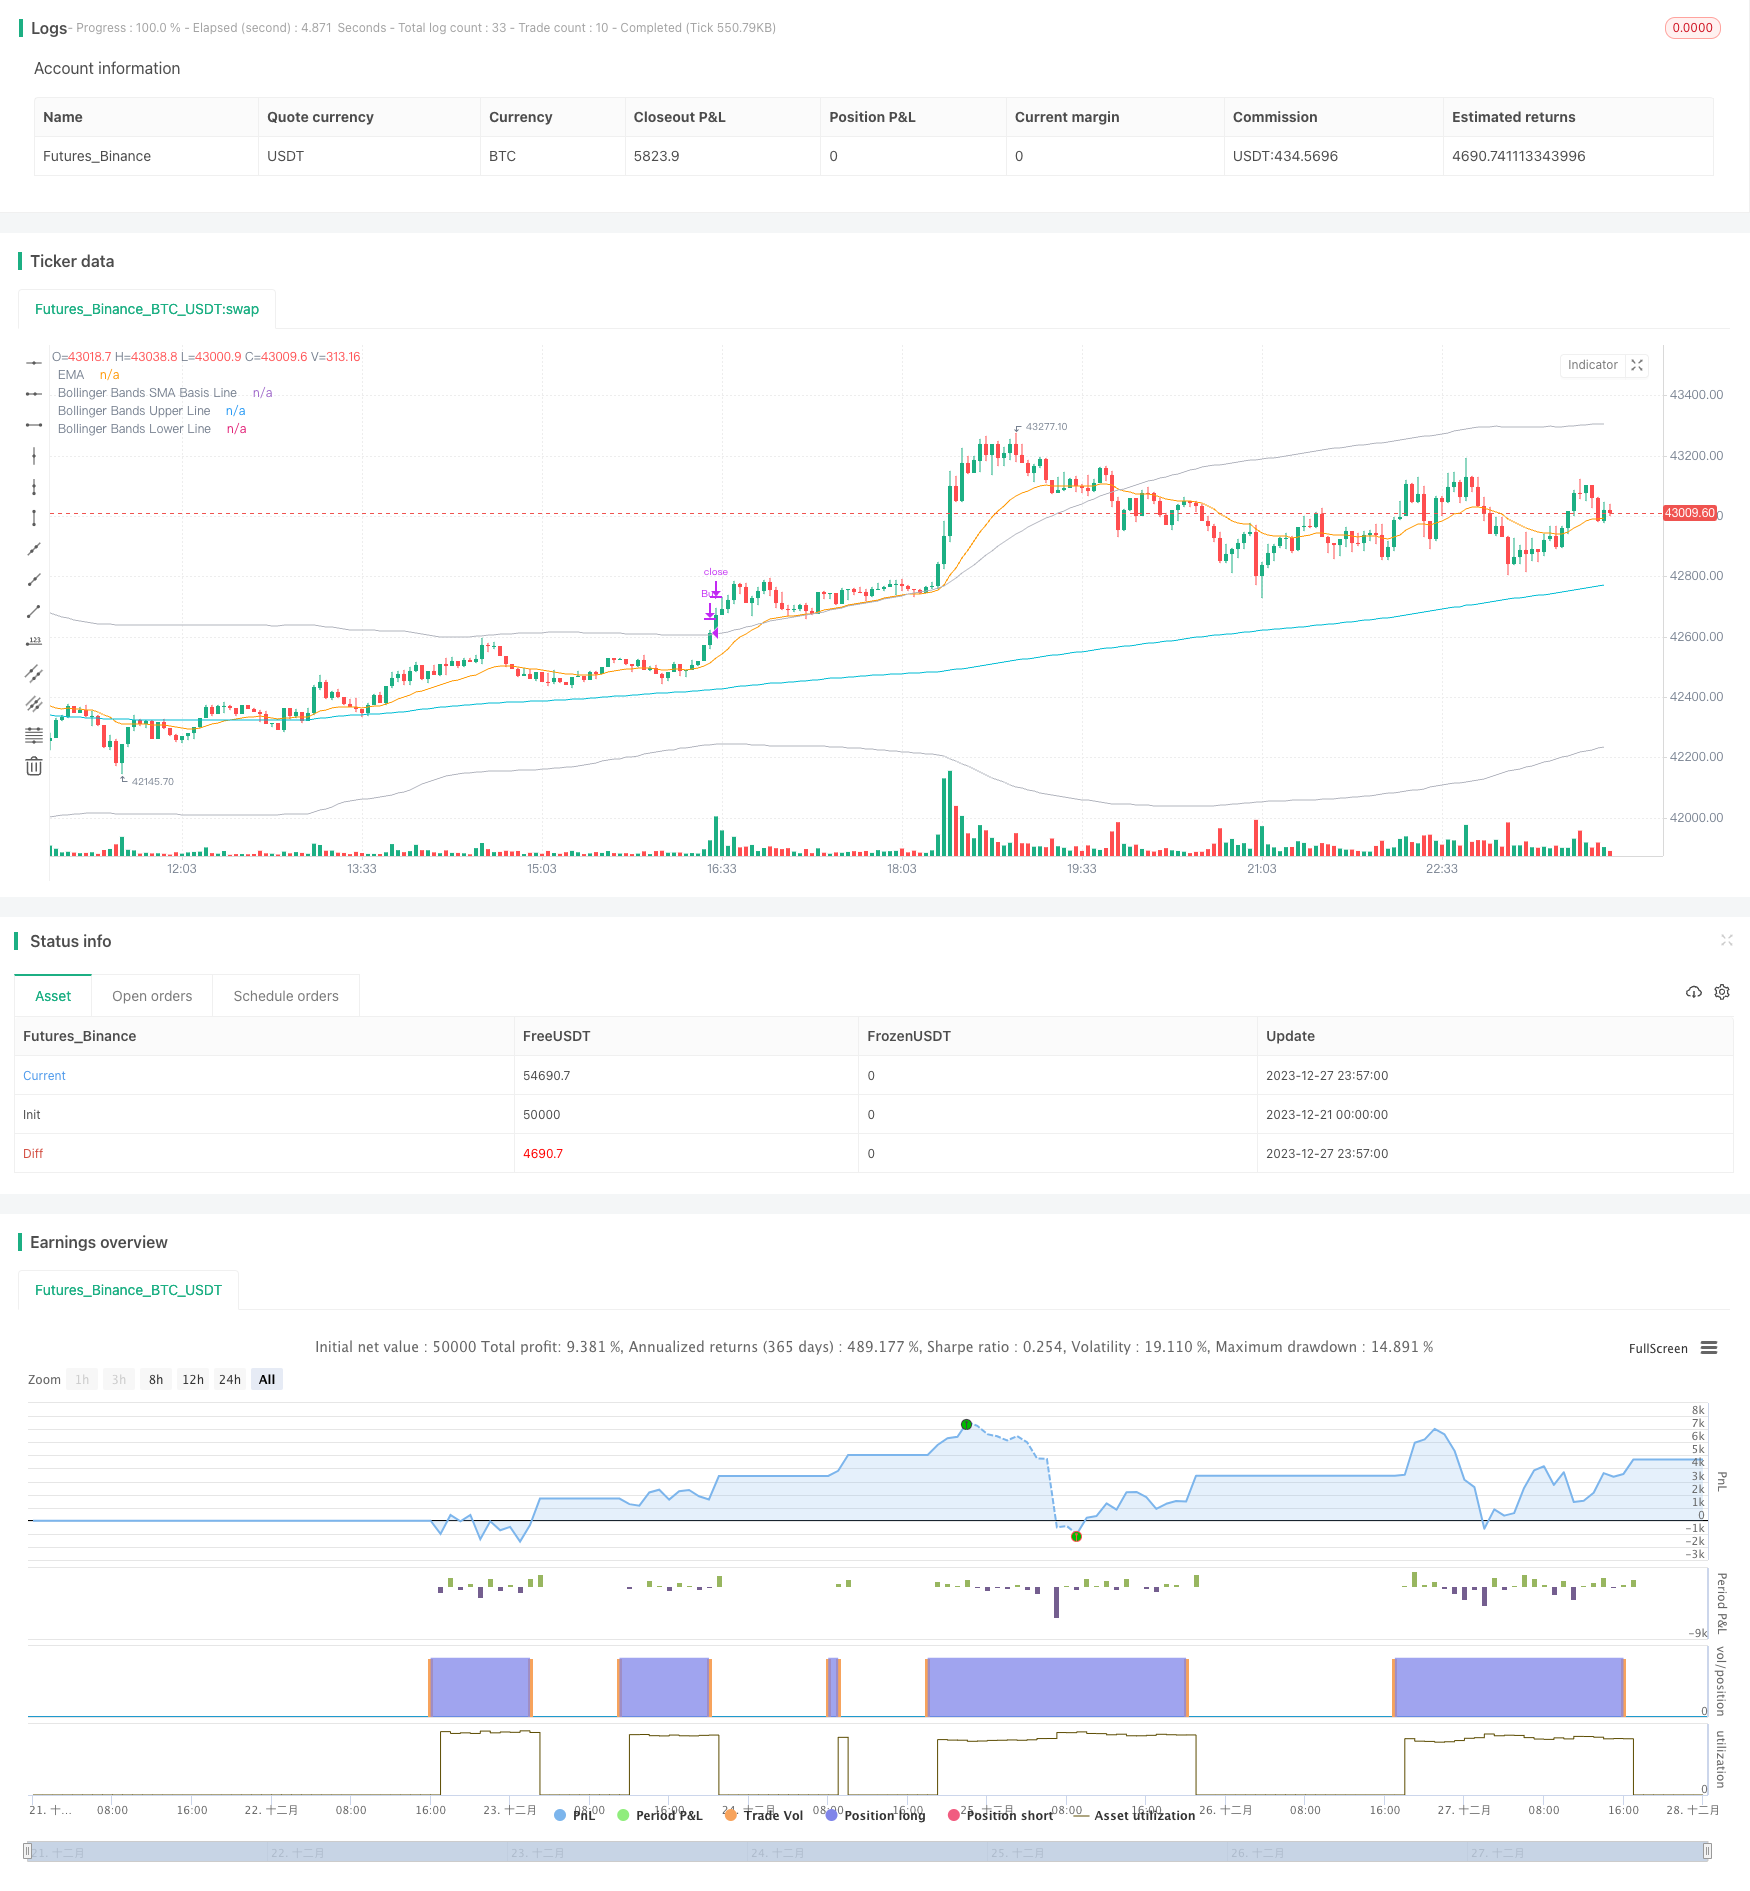
概述
本策略集成了布林带、相对强弱指数(RSI)和指数移动平均线(EMA)三个指标,实现了一个长线持有的股票自动交易策略。当RSI低于超卖线且价格接近或触及布林带下轨时产生买入信号;当价格上涨触及布林带上轨时产生卖出信号,实现了利用布林带判断市场趋势和超买超卖的双重过滤。
策略原理
本策略主要基于布林带、RSI和EMA三个指标进行判断。布林带中的中轨线是价格的简单移动平均线,上下轨线分别是价格标准差的两倍范围。布林带能够判断市场的超买超卖现象,价格接近下轨时为超卖现象,接近上轨时为超买现象。RSI指标判断股票是否超买超卖的重要指标之一,RSI低于30时为超卖,高于70时为超买。而EMA是价格的指数加权移动平均线,能够判断价格趋势。
本策略的买入条件为:RSI指标低于30的超卖线时产生买入信号,且需要同时满足价格已经接近或触及布林带下轨的超卖状态,这样可以避免假信号。
本策略的卖出条件为:价格上涨期间,当触及布林带上轨时产生卖出信号,comboBox1。这样利用布林带判断超买状态,进行止盈卖出。
策略优势
- 集成布林带和RSI指标,双重过滤判断超买超卖状态,避免假信号。
- 利用EMA判断价格趋势方向,避免逆势交易。
- RSI参数和布林带参数都可以自定义设置,适用于不同股票。
- 策略逻辑简单清晰,容易理解实现。
策略风险
- 布林带和RSI都可能产生错误信号,导致错误买入。
- 止损位置设置需要优化,回撤风险较大。
- EMA不能完美判断趋势,可能错过趋势反转点。
- 参数设置不当可能导致过于频繁交易或错过交易机会。
风险解决方法:
- 适当缩短布林带周期,优化RSI参数。
- 动态追踪止损。
- 集成其他指标判断趋势。
- 测试不同参数设置,寻找最优参数组合。
策略优化方向
本策略可以从以下几个方向进一步优化:
- 增加其他指标判断,如KD指标判断超买超卖。
- 增加止损策略,如移动止损、区间止损等方式管理风险。
- 在卖出条件中增加离场策略,如根据EMA判断趋势离场。
- 优化参数设置,改进获利空间,如调整布林带宽度。
- 增加开仓规则,避免假突破,如量能过滤。
总结
本策略集成布林带、RSI和EMA三个指标,实现了一个双重过滤判断的长线持有自动交易策略。判断超买超卖状态的双重过滤机制可以有效避免假信号,利用EMA判断趋势可以避免逆势交易。同时策略参数可以灵活设置,适用于不同股票,是一个简单实用的量化交易策略。通过优化止损策略、离场规则等,可以进一步提高策略效率和减少回撤风险。本策略为初学者提供了一个参考框架,有一定实用价值。
策略源码
/*backtest
start: 2023-12-21 00:00:00
end: 2023-12-28 00:00:00
period: 3m
basePeriod: 1m
exchanges: [{"eid":"Futures_Binance","currency":"BTC_USDT"}]
*/

//@version=4
strategy("Bollinger + RSI + EMA, Double Strategy Long-Only (by ChartArt) v1.3", shorttitle="rsi 30 min ADJ Buy", overlay=true)

///////////// RSI
RSIlength = input(2, title="RSI Period Length") // Adjusted RSI period length
RSIoverSold = input(30, title="RSI Oversold Level")  // Adjustable RSI oversold level
RSIoverBought = input(80, title="RSI Overbought Level")  // Adjustable RSI overbought level
price = close
vrsi = rsi(price, RSIlength)

///////////// Bollinger Bands
BBlength = input(231, minval=1, title="Bollinger Period Length") // Adjusted Bollinger period length
BBmult = 2
BBbasis = sma(price, BBlength)
BBdev = BBmult * stdev(price, BBlength)
BBupper = BBbasis + BBdev
BBlower = BBbasis - BBdev

///////////// EMA
useEMA = input(true, title="Use EMA?")
emaLength = input(20, title="EMA Period Length")
ema = useEMA ? ema(close, emaLength) : na

source = close
buyEntry = crossover(source, BBlower) or (close < BBlower and close > BBbasis) or (low < BBlower and close > BBbasis) // Add condition for low touching Bollinger Band
sellEntry = crossunder(source, BBupper)

///////////// Plotting
plot(BBbasis, color=color.aqua, title="Bollinger Bands SMA Basis Line")
plot(BBupper, color=color.silver, title="Bollinger Bands Upper Line")
plot(BBlower, color=color.silver, title="Bollinger Bands Lower Line")
plot(ema, color=color.orange, title="EMA")  // Plot EMA

///////////// RSI + Bollinger Bands Strategy
long = crossover(vrsi, RSIoverSold) and buyEntry
close_long = close >= BBupper

if (not na(vrsi))
    if long
        strategy.entry("Buy", strategy.long, qty=10, stop=BBlower, comment="Buy")
    else
        strategy.cancel(id="Buy")

    if close_long
        strategy.close("Buy")