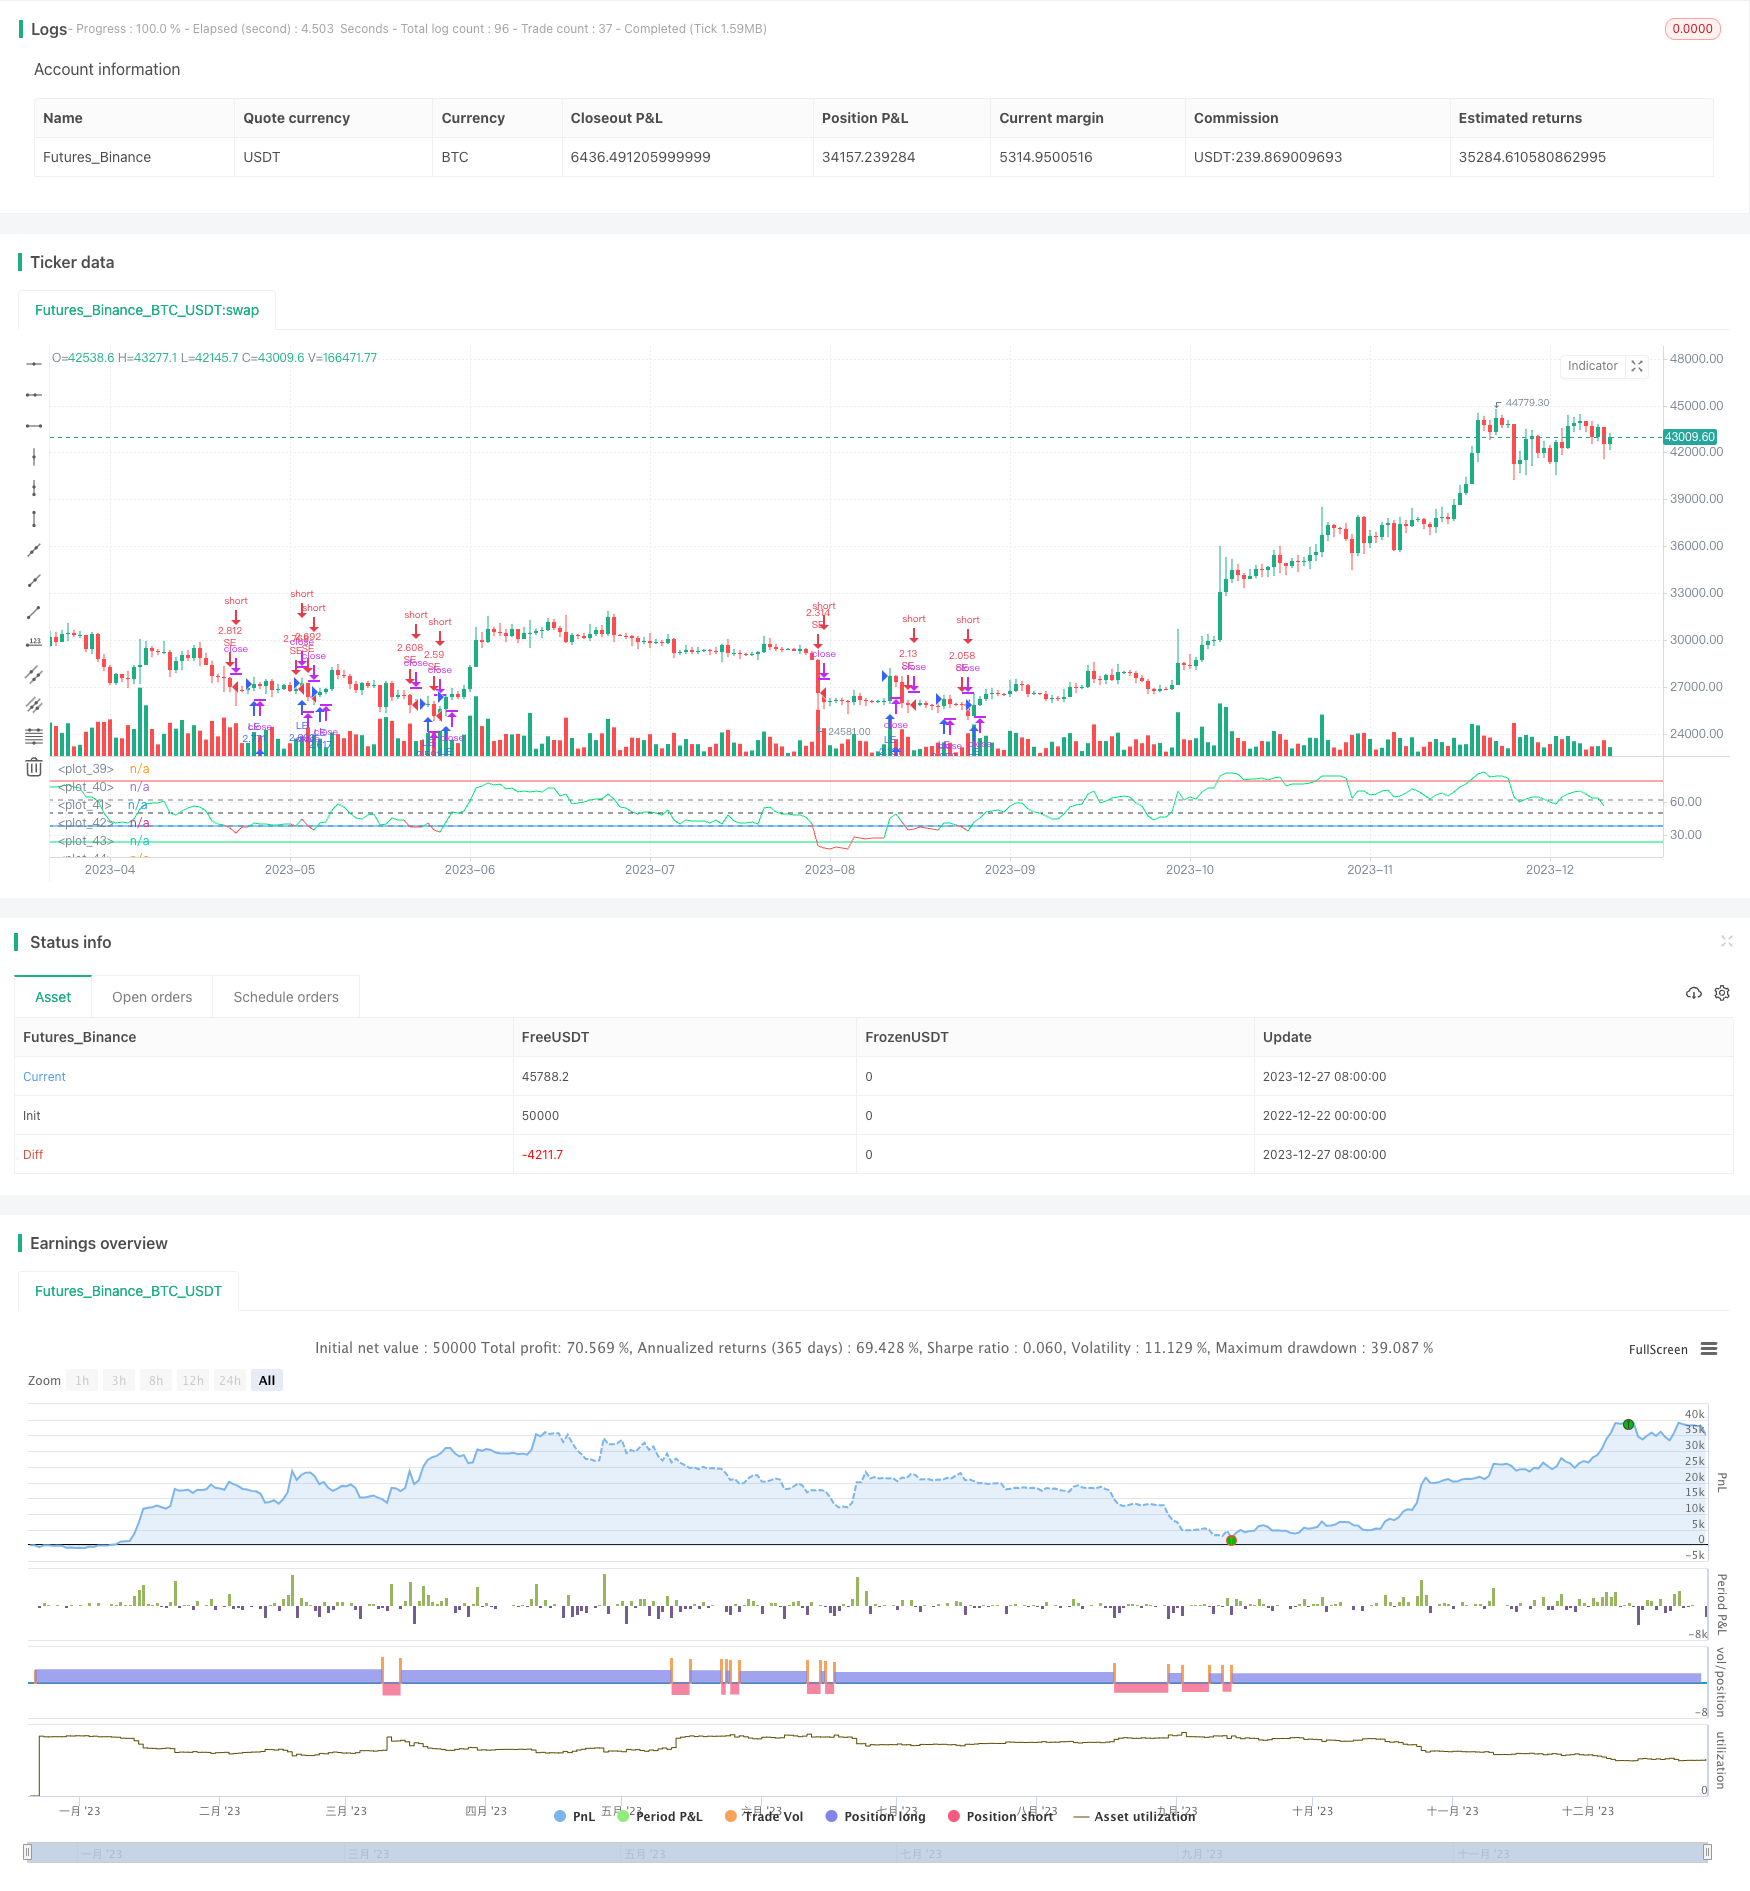
概述
RSI菲波那契回调策略通过计算RSI指标与设置的菲波那契回调级别的交叉作为交易信号,在超买超卖区域发生反转时入场,属于趋势跟踪策略。
原理
该策略基于RSI指标与菲波那契回调级别的交叉实现。首先计算RSI指标的值,然后设置菲波那契回调级别(38.2%、50%、61.8%),当RSI指标上穿菲波那契级别时生成买入信号,下穿时生成卖出信号。
RSI指标用于判断市场是超买还是超卖。RSI大于70时为超买区,小于30时为超卖区。当RSI从超买区下降到菲波那契回调区时,属于反转信号,做多;当RSI从超卖区上升到菲波那契回调区时,属于反转信号,做空。
菲波那契回调区在本策略中主要作为参考,与RSI形成交易信号。趋势市场中,回调后的继续运行常常会触碰菲波那契回调级别,这些级别相当于支持阻力。与RSI交叉做为交易信号,可以捕捉反转机会。
优势
使用RSI判断超买超卖形态,配合菲波那契回调区捕捉反转机会,可以过滤部分噪音。
趋势跟踪性质,可捕捉中长线趋势。
可以通过调整菲波那契回调区来适应不同市场情况。
风险
多空头寸持有时间可能较长,需要有足够的资金支持。
回调过程中可能出现再次探高探底现象,需要设置止损来控制风险。
参数设置不当可能导致交易频繁或捕捉不到足够反转机会。
优化方向
可以考虑结合其他指标过滤入场时机。例如MACD、布林带等指标判断趋势方向。
可以优化RSI参数以及菲波那契回调区设置。
可以设置动态止损来锁定利润。
总结
RSI菲波那契回调策略整体作为一个趋势跟踪策略,具有很好的稳定性。相比单一RSI策略,加入菲波那契回调区可以有效过滤部分噪声交易。通过参数优化可以适应不同市场的交易品种。总体来说是一个可靠、易于优化的策略思路。
策略源码
/*backtest
start: 2022-12-22 00:00:00
end: 2023-12-28 00:00:00
period: 1d
basePeriod: 1h
exchanges: [{"eid":"Futures_Binance","currency":"BTC_USDT"}]
*/

// (c) ReduX_o, 2019. All rights reserved.
//
// How to trade:
// The indicator is more reliable in longer time frames
// Choose a fibonacci level as reference
// Buy when the RSI line turns green
// Sell when the RSI line turns red


//@version=4
strategy("RSI Fibonacci Levels", overlay=false, initial_capital=2000, currency=currency.USD, commission_value=0.1, slippage=0, commission_type=strategy.commission.percent, pyramiding=0, default_qty_type=strategy.percent_of_equity, default_qty_value=100)


len = input(14, minval=1, title="Rsi Periods")
f1 = input(title="Fibonacci Level", defval="38.2", options=["38.2", "50", "61.8"])

// === BACKTEST RANGE ===
FromYear = input(defval=2010, title="From Year", minval=2010)
FromMonth = input(defval=1, title="From Month", minval=1)

ToYear = input(defval=2020, title="To Year", minval=2010)
ToMonth = input(defval=1, title="To Month", minval=1)


src = hl2
fi= (f1 == "38.2") ? 38.2 : (f1 == "50")? 50 : 61.8


up = rma(max(change(src), 0), len)
down = rma(-min(change(src), 0), len)
rsi = down == 0 ? 100 : up == 0 ? 0 : 100 - 100 / (1 + up / down)


//***************************************************
rcolor = rsi >= fi ? color.lime : color.red

plot(rsi, title="RSI", color=rcolor, transp=0)
band1 = hline(78.6, color=color.red, linestyle= hline.style_solid,  editable= false)
band0 = hline(23.6, color=color.lime, linestyle= hline.style_solid, editable= false)
band2 = hline(61.8, color=color.gray, editable= false)
band3 = hline(50, color=color.black, editable= false)
band4 = hline(38.2, color=color.gray, editable= false)
band5 = hline(fi, color=color.blue, linestyle= hline.style_solid, editable= false)

strategy.entry("LE", strategy.long, comment="L", when=rsi >= fi )
strategy.entry("SE", strategy.short, comment="S", when=rsi < fi )