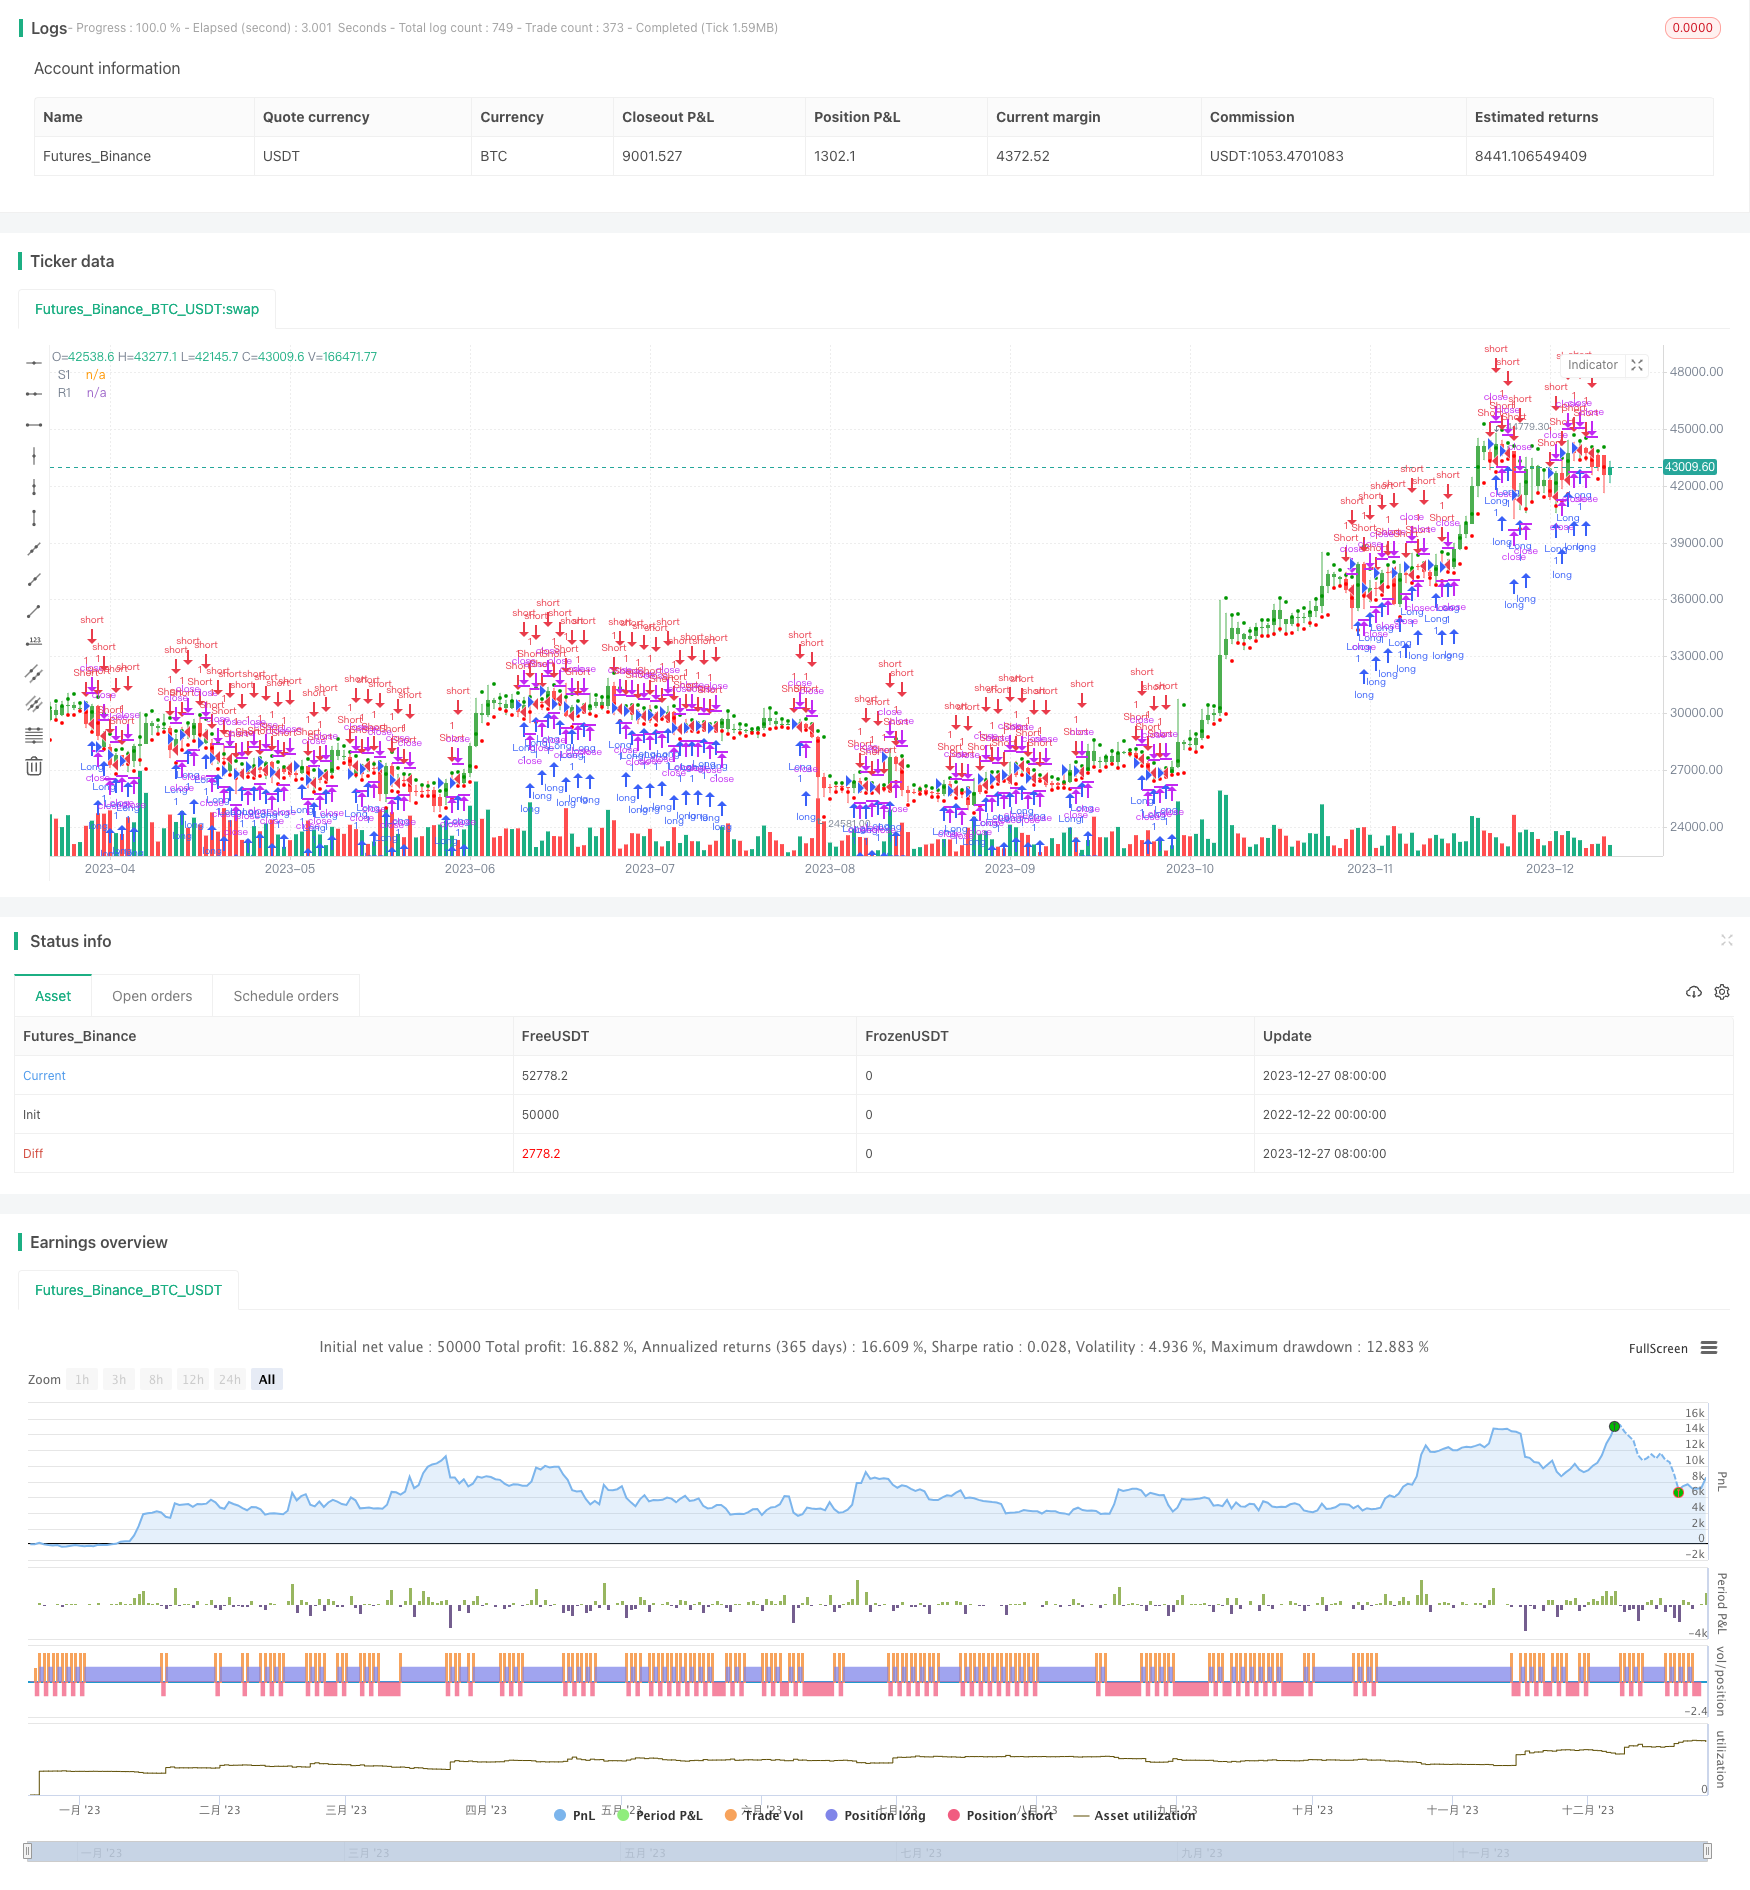
概述
本策略基于前一交易日的最高价、最低价和收盘价计算出的支撑阻力位,在当前交易日进行长仓或短仓的操作。当价格突破上方阻力位R1时,做多;当价格跌破下方支撑位S1时,做空。该策略属于动态支撑阻力策略。
策略原理
根据前一交易日的最高价xHigh、最低价xLow和收盘价xClose计算出当日的支撑位S1、阻力位R1和枢轴点vPP。
vPP = (xHigh+xLow+xClose) / 3
vR1 = vPP+(vPP-xLow)
vS1 = vPP-(xHigh - vPP)
判断价格是否突破vR1或者vS1,如果突破vR1则做多,如果跌破vS1则做空。POS记录做多做空方向。
pos = iff(close > vR1, 1,
iff(close < vS1, -1, nz(pos[1], 0)))possig记录实际交易方向。如果开启反转交易reverse=true,则交易信号取反。
根据possig信号,在突破vR1时做多,突破vS1时做空。
策略优势
- 该策略利用动态支撑阻力指标,能够捕捉突破性行情。
- 支撑阻力位每日更新,具有动态性。
- 可以选择正向交易或反转交易,适用于不同市场环境。
- 策略思路简单清晰,容易理解实现。
- 可视化展示支撑阻力位,直观判断趋势发生转折。
风险分析
- 若行情震荡,可能触发多次不必要的买卖信号。
- 若出现异常趋势性行情,支撑阻力可能被突破后继续延伸,造成损失。
- 枢轴点及支撑阻力位计算方法较为简单,有待进一步优化。
风险解决方法:
- 适当调整持仓规模,控制单笔损失。
- 设置止损位,避免超出可承受损失。
- 结合其它指标过滤信号,避免在震荡行情中频繁交易。
优化方向
- 优化支撑阻力位的计算方法,使其更具有预测性。
- 增加对趋势、Momentum等指标的结合,避免不必要的交易。
- 增加止损策略,控制单笔及最大损失。
- 结合机器学习方法,使支撑阻力位计算能够动态优化。
总结
本策略基于动态支撑阻力指标,根据价格突破的方向进行持仓。策略思路简单,易于理解和实现,能够有效捕捉趋势的转折点。但也存在一定的风险,需要进一步结合其它指标进行优化,使交易信号更加准确可靠。总的来说,该策略适合用作辅助判断指标,或作为量化交易的基础策略之一。
策略源码
//@version=2
////////////////////////////////////////////////////////////
//  Copyright by HPotter v1.0 14/06/2018
// This Pivot points is calculated on the current day.
// Pivot points simply took the high, low, and closing price from the previous period and
// divided by 3 to find the pivot. From this pivot, traders would then base their
// calculations for three support, and three resistance levels. The calculation for the most
// basic flavor of pivot points, known as ‘floor-trader pivots’, along with their support and
// resistance levels.
//
// You can change long to short in the Input Settings
// WARNING:
// - For purpose educate only
// - This script to change bars colors.
////////////////////////////////////////////////////////////
strategy(title="Dynamic Pivot Point Backtest", shorttitle="Dynamic Pivot Point", overlay = true)
reverse = input(false, title="Trade reverse")
xHigh  = request.security(syminfo.tickerid,"D", high[1])
xLow   = request.security(syminfo.tickerid,"D", low[1])
xClose = request.security(syminfo.tickerid,"D", close[1])
vPP = (xHigh+xLow+xClose) / 3
vR1 = vPP+(vPP-xLow)
vS1 = vPP-(xHigh - vPP)
pos = iff(close > vR1, 1,
       iff(close < vS1, -1, nz(pos[1], 0)))
possig = iff(reverse and pos == 1, -1,
          iff(reverse and pos == -1, 1, pos))
if (possig == 1)
    strategy.entry("Long", strategy.long)
if (possig == -1)
    strategy.entry("Short", strategy.short)
barcolor(possig == -1 ? red: possig == 1 ? green : blue )
plot(vS1, color=#ff0000, title="S1", style = circles, linewidth = 1)
plot(vR1, color=#009600, title="R1", style = circles, linewidth = 1)