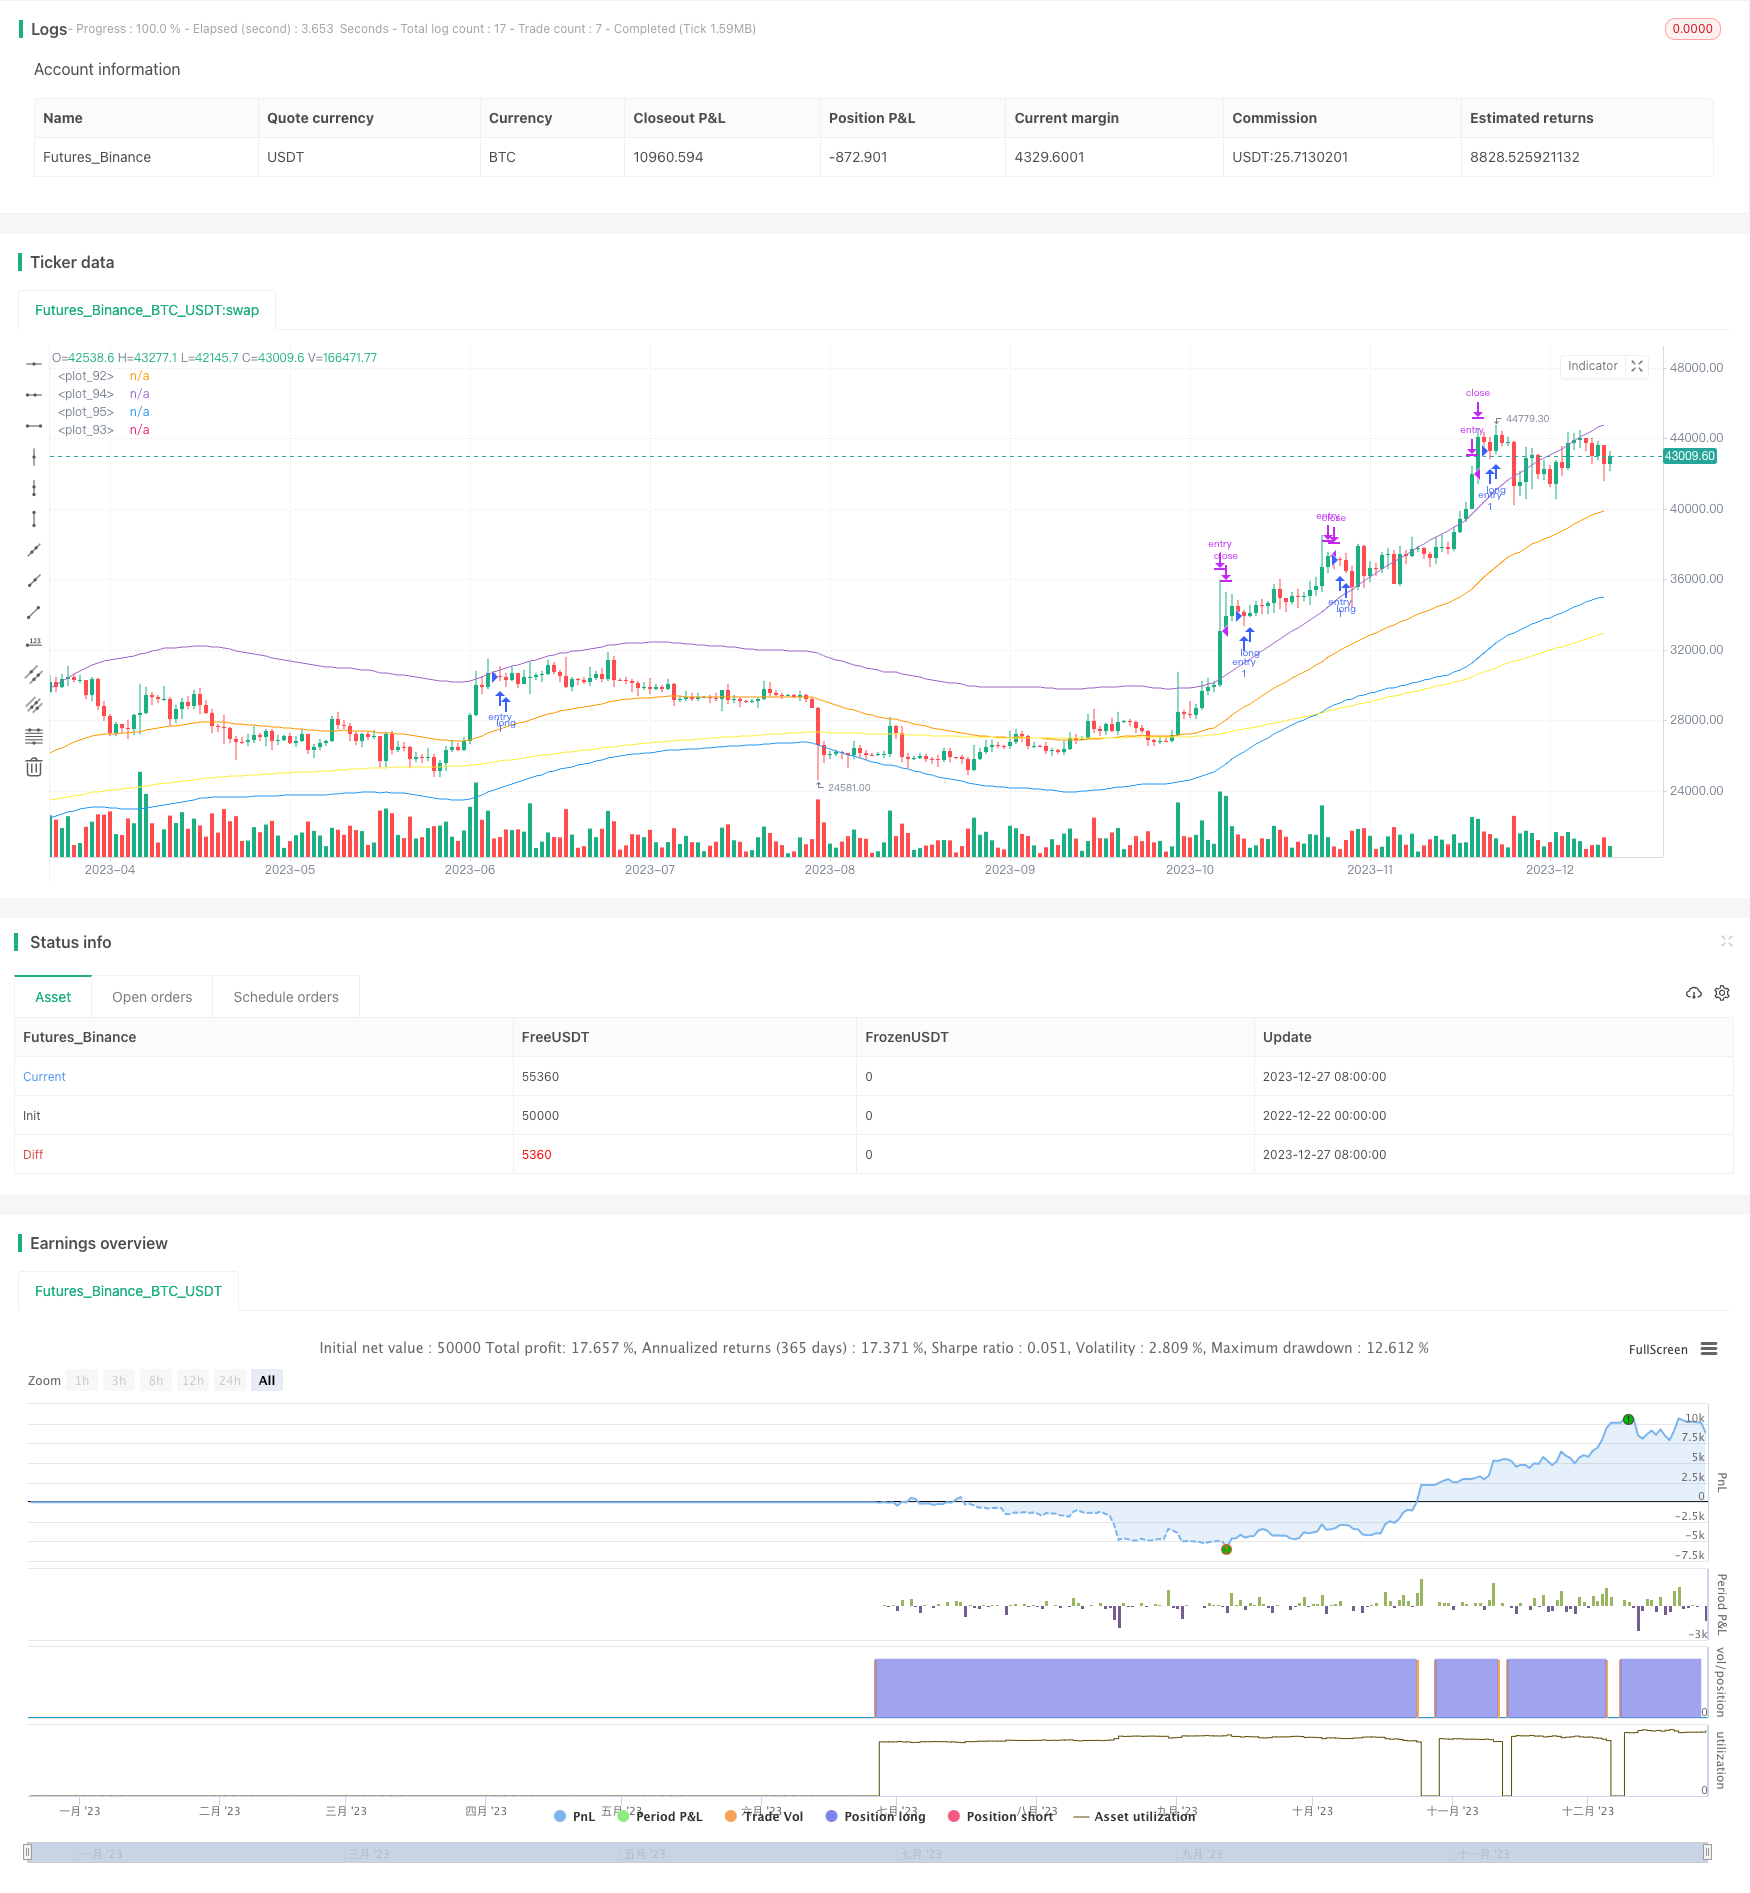
概述
动态止盈追趋策略通过检测长期趋势和短期回调,实现低买高卖,追捧上涨趋势的目的。该策略同时使用波动单位来检测盈亏大小,使其适用于所有币种而无需担心百分比变化。
策略原理
该策略 buying的逻辑是:当出现长期上涨趋势(200日EMA上涨,200日RSI大于51)和短期下跌回调(最后2根K线收盘价下跌)时,进行买入开仓。
selling的逻辑是:当价格上涨超过1个波动单位时止盈;当价格下跌超过2个波动单位时止损。
波动单位的计算是:以50日内收盘价标准差的2倍作为基础波动单位。这样可以检测出不同币种自己的波动情况,无需人为设置百分比。
优势分析
该策略最大的优势是可以动态检测不同币种的波动大小,根据币种本身的波动设置止盈止损单位。这避免了百分比止盈固定设置的问题,可以自动适应更多币种。
另一个优势是结合长短期判断,可以有效过滤假突破。利用长期趋势判断未来可能上涨的币,再结合短期回调信号,可以有效避免布林带squeeze等假信号。
风险分析
该策略最大的风险在于止盈止损单位的设定。如果波动过大,止盈距离可能过近,无法持续追涨;如果波动过小,则可能止损过快。这需要通过更长周期EMA作为辅助,来避免波动单位判断失误。
另一个风险是策略对短期趋势判断的依赖。如果出现长期上涨但短期不回调的情况,会错过入场时机。这可能需要加入其他辅助判断指标。
优化方向
该策略可以从以下几个方向进行优化:
增加更长周期EMA判断,避免波动单位失误
增加交易量等指标来判断趋势,减少对短期k线的依赖
优化开仓和平仓条件,设置更严格的入场规则
结合机器学习算法判断趋势方向,实现更高胜率
总结
动态止盈追趋策略整体思路清晰,核心在于动态波动单位的设定。该策略可以自动适应不同币种设置盈亏单位,无需人工设置百分比。同时结合长短期双重判断,可以有效滤除假信号。通过进一步优化,该策略可以成为高效率的趋势追踪策略。
/*backtest
start: 2022-12-22 00:00:00
end: 2023-12-28 00:00:00
period: 1d
basePeriod: 1h
exchanges: [{"eid":"Futures_Binance","currency":"BTC_USDT"}]
*/

// @version=4
// This source code is subject to the terms of the Mozilla Public License 2.0 at https://mozilla.org/MPL/2.0/
// © BHD_Trade_Bot

strategy(shorttitle='Take Profit On Trend',
 title='Take Profit On Trend (by BHD_Trade_Bot)',
 overlay=true,
 initial_capital = 15,
 default_qty_type = strategy.cash,
 default_qty_value = 15,
 commission_type=strategy.commission.percent,
 commission_value=0.1)


//Backtest Time
start_day = 1
start_month = 1
start_year = 2021
end_day = 1
end_month = 1
end_year = 2050
start_time = timestamp(start_year, start_month, start_day, 00, 00)
end_time = timestamp(end_year, end_month, end_day, 23, 59)
is_back_test_time() =>
    time >= start_time and time <= end_time ? true : false

// Last bar
h1_last_bar = (timenow - time)/1000/60/60 < 2


// EMA
ema50 = ema(close, 50)
ema200 = ema(close, 200)

// RSI length 200
rsi200 = rsi(close, 200)

// Bollinger Bands length 50
bb50 = 2 * stdev(close, 50)

// BHD Unit
bhd_unit = sma(bb50, 100)
bb50_upper = ema50 + bhd_unit
bb50_lower = ema50 - bhd_unit


// All n candles is going down
all_body_decrease(n) =>
    isValid = true
    for i = 0 to (n - 1)
        if (close[i] > close[i + 1])
            isValid := false
            break
    isValid


// ENTRY

// Long-term uptrend
entry_condition1 = rsi200 > 51

// Short-term downtrend
entry_condition2 = all_body_decrease(2)

ENTRY_CONDITION = entry_condition1 and entry_condition2

if (ENTRY_CONDITION and is_back_test_time())
    strategy.entry("entry", strategy.long)


// CLOSE CONDITIONS

// Price increase 1 BHD unit
TAKE_PROFIT = close > strategy.position_avg_price + bhd_unit

// Price decrease 2 BHD unit
STOP_LOSS = close < strategy.position_avg_price - bhd_unit * 2

CLOSE_CONDITION = TAKE_PROFIT or STOP_LOSS

if (CLOSE_CONDITION or h1_last_bar)
    strategy.close("entry")


// Draw
plot(ema50)
plot(ema200, color=color.yellow)
plot(bb50_upper)
plot(bb50_lower)