Trend Following Strategy Based on QQE and MA

Overview
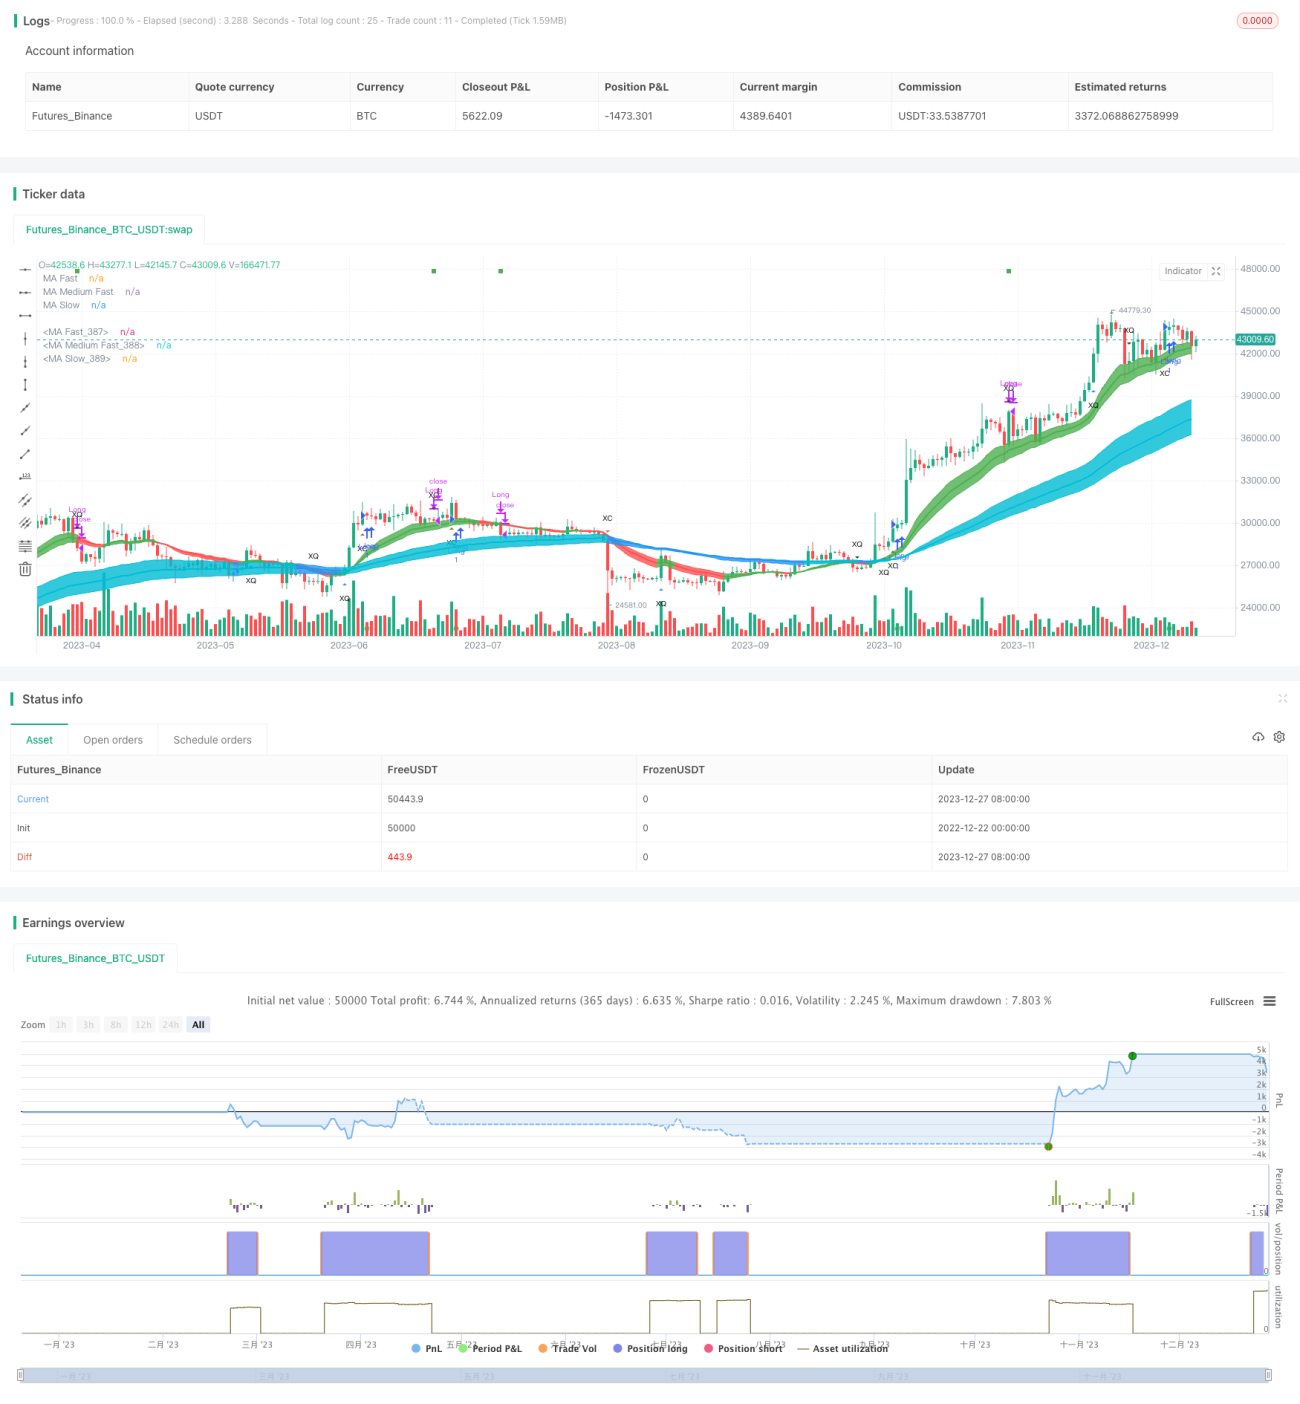
This is a trend following strategy based on the QQE (Qualitative Quantitative Estimation) indicator and moving averages. It determines the trend direction and generates trading signals based on fast QQE crosses filtered by the direction of moving averages.
The strategy can use three kinds of QQE crosses to determine the trading signal: (1) Smooth RSI crossing 0 line; (2) Smooth RSI crossing fast QQE line; (3) Smooth RSI exiting the RSI threshold channel. By default it uses the third cross to open position and the second cross to close position.
The buy and sell signals can choose to add an additional filter by moving averages: the close price should be above (below) the fast MA line, and the fast MA line should be above (below) the slow MA line, to generate a trading signal.
This strategy is suitable to be used in automated trading with signal-to-signal mode.
Principle
The core indicator of this strategy is QQE. Its calculation formula is as below:
Wilders_Period = RSILen * 2 - 1
Rsi = rsi(close,RSILen)
RSIndex = ema(Rsi, SF)
AtrRsi = abs(RSIndex - RSIndex[1])
MaAtrRsi = ema(AtrRsi, Wilders_Period)
DeltaFastAtrRsi = ema(MaAtrRsi,Wilders_Period) * QQEfactor
newshortband = RSIndex + DeltaFastAtrRsi
newlongband = RSIndex - DeltaFastAtrRsi
Where RSILen is the length period of RSI, and SF is the RSI smoothing factor. QQE is essentially a smoothed RSI. It calculates an upper and lower channel based on a fast ATR, and the crossing of price over the channel indicates buy or sell signals.
The strategy uses three kinds of QQE crosses to identify trading signals:
- Smooth RSI crossing 0 line (XZ)
            QQEzlong = RSIndex >= 50 ? QQEzlong + 1 : 0
QQEzshort = RSIndex < 50 ? QQEzshort + 1 : 0
- Smooth RSI crossing fast QQE line (XQ), like an early swing signal
            QQExlong = FastAtrRsiTL < RSIndex ? QQExlong + 1 : 0
QQExshort = FastAtrRsiTL > RSIndex ? QQExshort + 1 : 0
- Smooth RSI exiting threshold channel (XC), like a confirmed swing signal
            threshhold = 10
QQEclong = RSIndex > (50 + threshhold) ? QQEclong + 1 : 0
QQEcshort = RSIndex < (50 - threshhold) ? QQEcshort + 1 : 0
One or multiple of the above three crosses can be selected to identify entry and exit signals.
The buy and sell signals can choose to add an additional filter by moving averages:
            // Filter condition
QQEflong = close > ma_medium AND
            ma_medium > ma_slow AND
            ma_fast > ma_medium

QQEfshort = close < ma_medium AND
            ma_medium < ma_slow AND
            ma_fast < ma_medium
This helps avoid false signals in sideways markets.
The strategy is suitable for automated trading by using different QQE crosses for entries and exits:
            Entry signal = XC OR XQ OR XZ
Exit signal = XQ OR XZ
Advantages
The advantages of this strategy include:
-
Using the QQE indicator to determine trend and cross signals. QQE itself has the characteristic of smoothing and noise reduction, which can decrease false signals.
-
Adding filter by moving averages can further avoid false signals in sideways markets and improve signal quality.
-
Choosing different QQE crosses for entry and exit enables automated trading.
-
The smooth RSI signal has lagging effect, so the buy/sell signals will not repaint.
-
The parameters can be optimized on different timeframes to find the best combination.
Risks
There are also some risks of this strategy:
-
Wrong signals may occur during trend reversal. Stop loss should be set to control risks.
-
Inappropriate parameter settings can affect strategy performance. Multiple tests and optimizations are needed to find the best parameters.
-
Different symbols and timeframes need separate test and parameter tuning.
-
Mechanical trading has risks of drawdown and consecutive losses. Position sizing and risk management are necessary.
The corresponding solutions are:
-
Set stop loss to exit positions when loss reaches a certain amount.
-
Test different parameter combinations thoroughly to find the optimal parameters.
-
Adjust parameters according to symbol and timeframe characteristics.
-
Use proper capital management, scale-in positions, and control per trade position size.
Optimization Directions
There are several directions that this strategy can be optimized:
-
Optimize QQE parameters including RSI length, RSI smoothing length, fast ATR length etc, to find the optimal parameter combination.
-
Optimize moving average parameters, adjust period, type etc to match best with QQE indicator.
-
Test different QQE crosses for entry and exit to find the most stable combination.
-
Fine tune parameters according to different symbols and timeframes. Use shorter periods for lower timeframes and intraday trading.
-
Add stop loss mechanism to stop out when loss reaches certain percentage.
-
Appropriately reduce position sizing and test different position management methods.
Conclusion
This strategy integrates using the QQE indicator for judging trend and crosses, and the moving average for filter, to generate trading signals. During live trading it can be optimized by adjusting parameters to improve signal quality, and by strict money management to control risks. The strategy suits automated trading with signal-to-signal mode, and can also aid discretionary trading. Further optimizations on logics and parameters can make it adaptable to more market conditions.
- 1