资源加载中... loading...

Turtle Trading Strategy Based on Simple Moving Average

Author: ChaoZhang, Date: 2023-12-29 16:45:51
Tags:

img

Overview

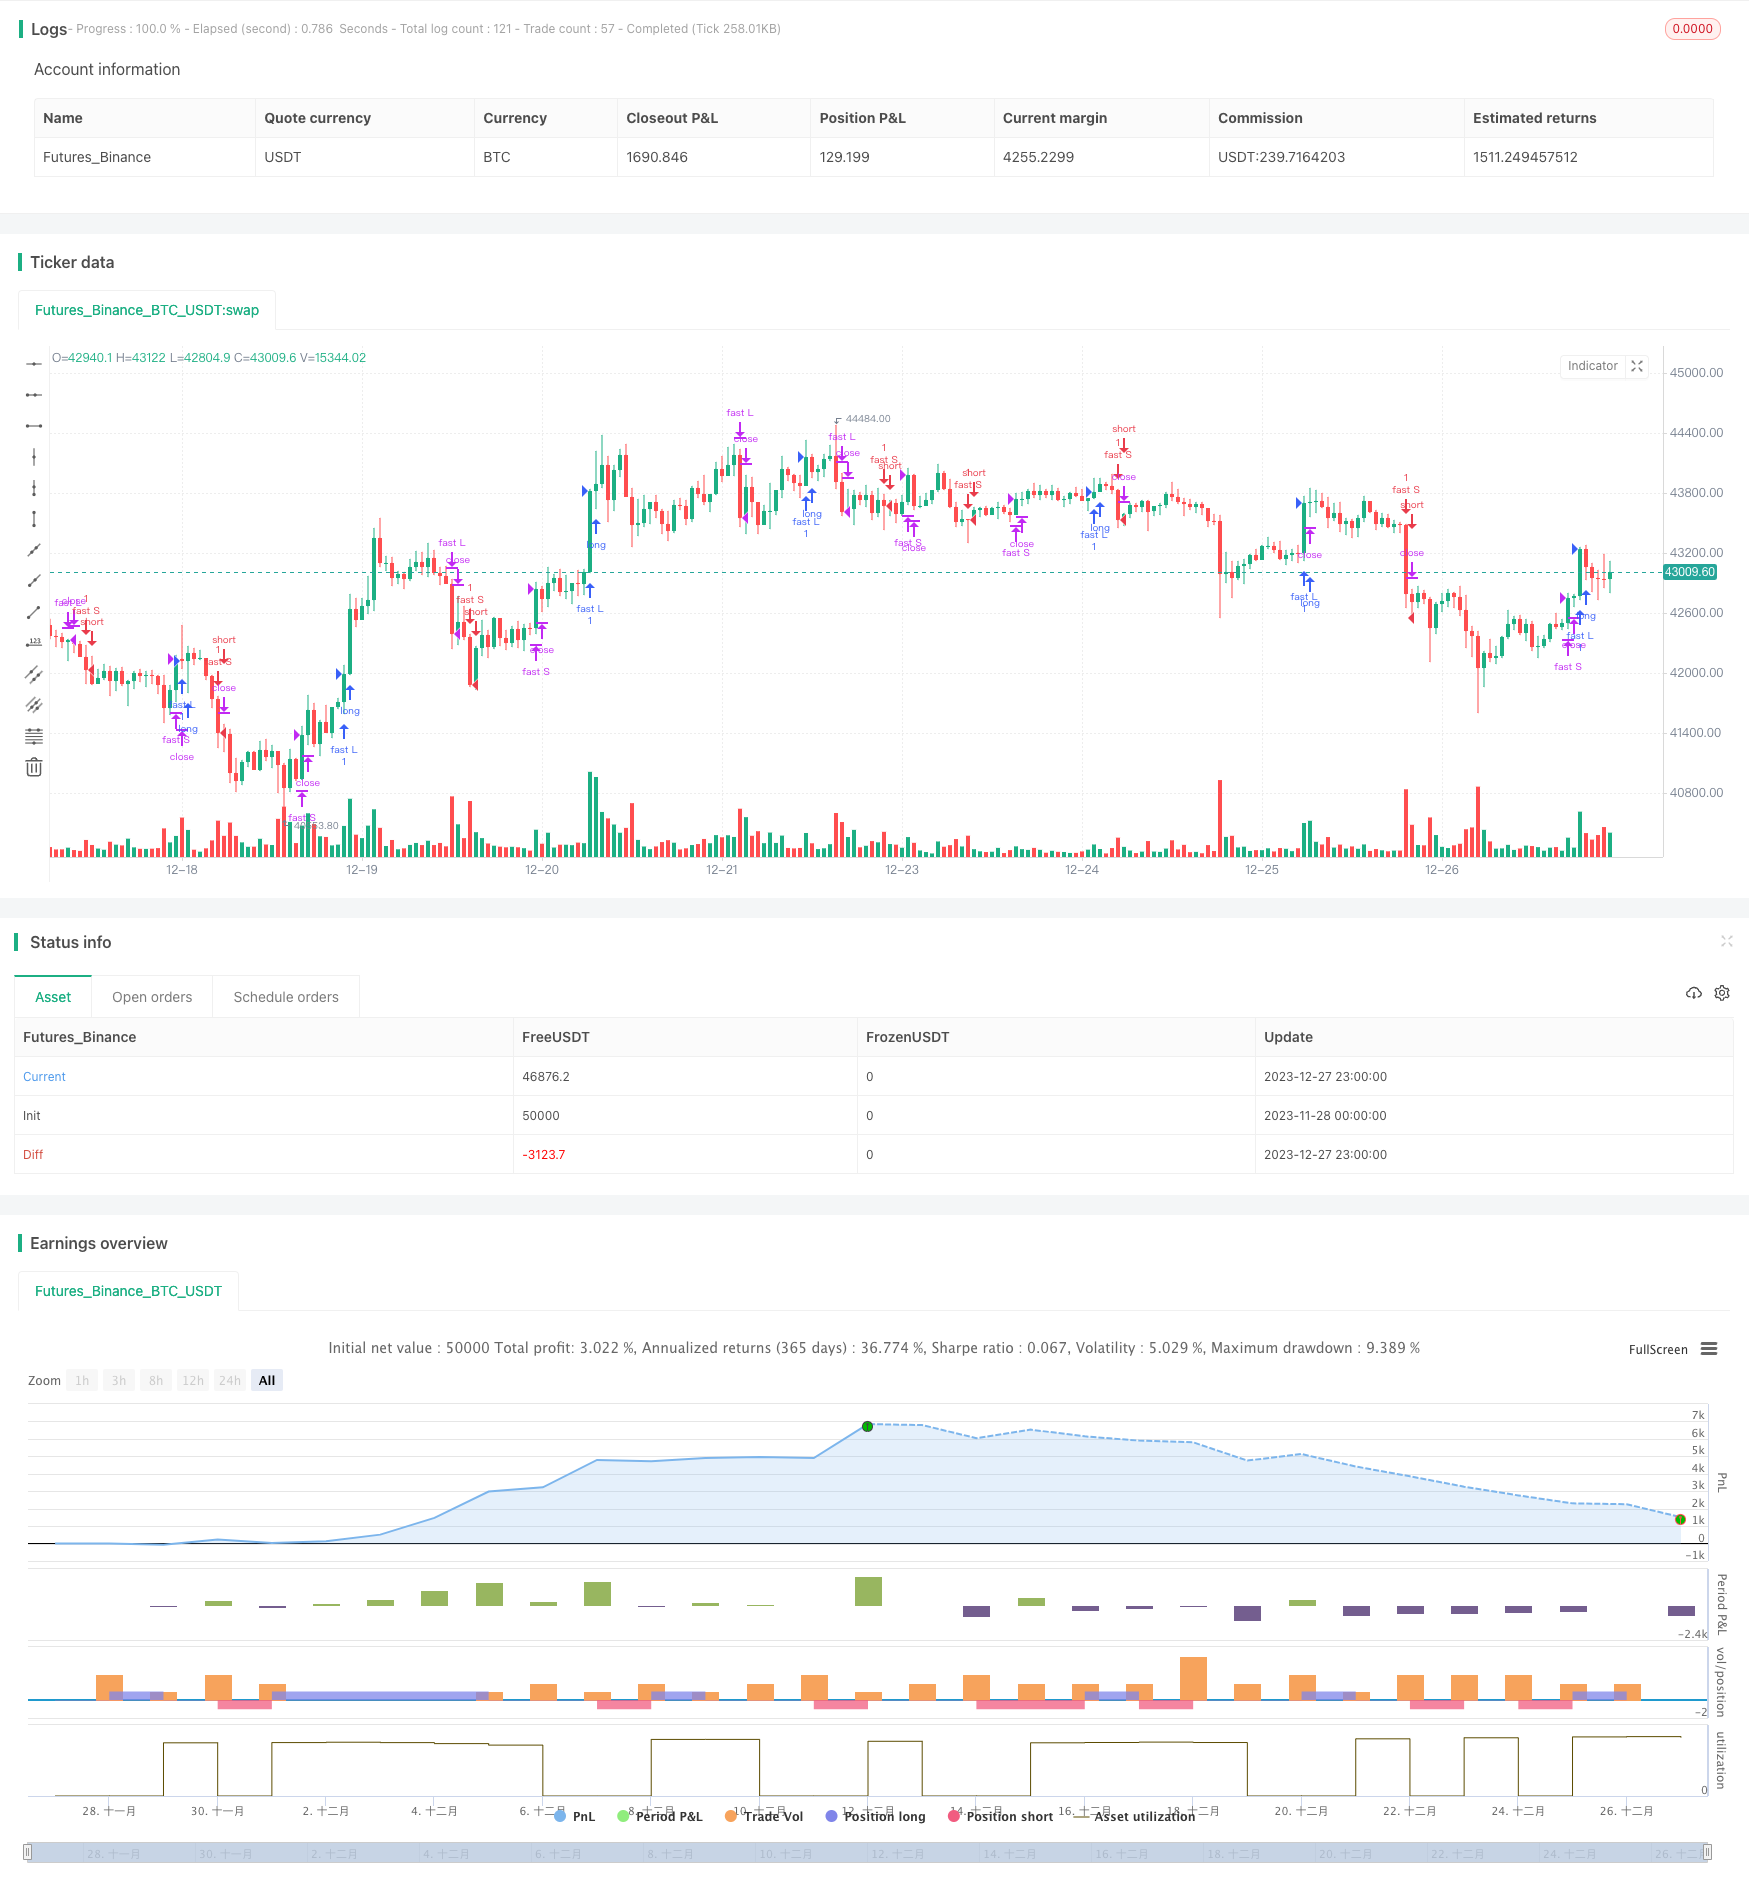
This strategy generates profit by calculating two groups of simple moving averages with different parameters and using them as signals for opening and closing positions. The strategy was first proposed by American trader Richard Dennis in 1983. By following simple rules, it achieved steady profits and was further popularized by Curtis Faith, widely known as the “turtle trading strategy”.

Principles

The strategy simultaneously computes two groups of fast and slow lines. The fast line parameters are set to 20 days for opening positions and 10 days for closing positions. The slow line parameters are 55 days and 20 days respectively. When the price crosses above the highest value of the fast line’s opening period, it triggers a long signal. When the price falls below the lowest value of the fast line’s opening period, it triggers a short signal. Similarly, when the price falls below the lowest value of the fast line’s closing period, it closes long positions. When the price breaks through the highest value of the fast line’s closing period, it closes short positions. The slow line has the same logic for opening and closing positions as the fast line.

The strategy relies on the moving average theory to make profits. That is, when the short-term moving average crosses above the long-term one, it is considered a bullish signal. When it crosses below, it signals a downward trend. The fast and slow lines in this strategy play similar roles.

Advantages

  1. Simple and clear rules, easy to understand and implement, suitable for beginners;
  2. Clear criteria for opening and closing positions, avoiding frequent trading;
  3. Combining fast and slow dual moving averages smooths out price fluctuations and generates clearer trading signals;
  4. The use of multiple parameter sets helps control risks and prevents erroneous trades;
  5. Steady profits in the long run, validated in live trading.

Risks and Mitigations

  1. The strategy itself is mechanical and cannot make judgments about special market conditions, thus having profit limitations;
    • Attempt to incorporate more indicators or machine learning models to aid decision-making
  2. Moving averages as lagging indicators have some latency;
    • Appropriately shorten the opening and closing periods
  3. Unable to limit maximum drawdown.
    • Set stop-loss points

Optimization Directions

  1. Add stop-loss module to control maximum drawdown
  2. Incorporate other indicators to filter signals
  3. Dynamically adjust moving average parameters
  4. Add data processing module to eliminate impacts of abnormal data
  5. Incorporate machine learning models to determine trends

Summary

This is a typical trend-following strategy. By establishing trading rules based on simple dual moving averages and tracking market trends, it achieves steady profits. The strategy is easy to understand and implement with clear opening signals and long-term verified profits from live trading, making it very suitable for beginners to learn and research. It also lays the foundation for more complex quantitative trading. Further optimizations can lead to even better performance.


/*backtest
start: 2023-11-28 00:00:00
end: 2023-12-28 00:00:00
period: 1h
basePeriod: 15m
exchanges: [{"eid":"Futures_Binance","currency":"BTC_USDT"}]
*/

//@version=2
//coded by tmr0
//original idea from «Way of the Turtle: The Secret Methods that Turned Ordinary People into Legendary Traders» (2007) CURTIS FAITH
strategy("20 years old Turtles strategy by tmr0", shorttitle = "Turtles", overlay=true)

enter_fast = input(20, minval=1)
exit_fast = input(10, minval=1)
enter_slow = input(55, minval=1)
exit_slow = input(20, minval=1)

fastL = highest(enter_fast)
fastLC = lowest(exit_fast)
fastS = lowest(enter_fast)
fastSC = highest(exit_fast)

slowL = highest(enter_slow)
slowLC = lowest(exit_slow)
slowS = lowest(enter_slow)
slowSC = highest(exit_slow)

enterL1 = high > fastL[1]
exitL1 = low <= fastLC[1]
enterS1 = low < fastS[1]
exitS1 = high >= fastSC[1]

enterL2 = high > slowL[1]
exitL2 = low <= slowLC[1]
enterS2 = low < slowS[1]
exitS2 = high >= slowSC[1]


//bgcolor(exitL1 or exitL2? red: enterL1 or enterL2? navy:white)

strategy.entry("fast L", strategy.long, when = enterL1)
strategy.entry("fast S", strategy.short, when = enterS1)
strategy.close("fast L", when = exitL1)
strategy.close("fast S", when = exitS1)

strategy.entry("slow L", strategy.long, when = enterL2)
strategy.entry("slow S", strategy.short, when = enterS2)
strategy.close("slow L", when = exitL2)
strategy.close("slow S", when = exitS2)
//zl=0
//z=strategy.netprofit / 37 * koef  //ежемесячная прибыль
//z=strategy.grossprofit/strategy.grossloss
//z1=plot (z, style=line, linewidth=3, color = z>zl?green:red, transp = 30)
//hline(zl, title="Zero", linewidth=1, color=gray, linestyle=dashed)
template: strategy.tpl:40:21: executing "strategy.tpl" at <.api.GetStrategyListByName>: wrong number of args for GetStrategyListByName: want 7 got 6