概述
过渡区间策略是一种基于价格波动区间的短线交易策略。它利用价格在一定时间区间内形成的波动区间来判断市场趋势,在区间突破时入场做多/空。
策略原理
该策略通过计算过去N根K线的最高价和最低价,构建出价格的波动区间。当最新K线 penetrates 该区间时,判断趋势发生转折,产生交易信号。
具体来说,策略持续追踪最后N根K线(可调节参数N)的最高价和最低价,其中:
- 最低价 = 过去N根K线中的最低点
- 最高价 = 过去N根K线中的最高点
这样便构建出了价格的波动区间。
当最新K线的收盘价高于区间最高价时,说明区间突破,产生做多信号;当最新K线的收盘价低于区间最低价时,说明区间突破,产生做空信号。
此外,策略还加入了颜色过滤器和实体过滤器。颜色过滤器根据K线的颜色来过滤信号;实体过滤器根据K线实体的大小来过滤信号。这可以过滤掉一些假信号。
策略优势
该策略具有如下优势:
- 捕捉价格区间,判断趋势转折点,精确做多做空
- 颜色过滤和实体过滤,可过滤假信号
- 策略逻辑简单清晰,容易理解和调整参数
- 可调整的参数较多,可以优化策略
风险分析
该策略也存在一些风险:
- 参数设置不当可能导致过于频繁交易,产生过高交易费用
- 区间范围设置不当,可能导致区间突破假信号太多
- 行情剧烈波动时,价格区间预测效果较差
- 无法处理价格跳空缺口的情况
可以通过调整区间参数,优化信号过滤条件等方法来降低这些风险。
优化方向
该策略可以从以下几个方向进行优化:
- 动态调整价格区间的范围,而不是固定的N根K线
- 加入止损逻辑,降低亏损风险
- 优化过滤器参数,提高信号质量
- 增加对价格缺口的处理逻辑
- 结合多个时间周期判断信号,避免被套
总结
过渡区间策略整体来说是一种较为简单实用的短线交易策略。它通过价格区间判断趋势转折点,可以快速抓住行情机会。同时也存在一些风险需要注意。通过参数调整和优化,可以进一步完善该策略,提高盈利效果。
策略源码
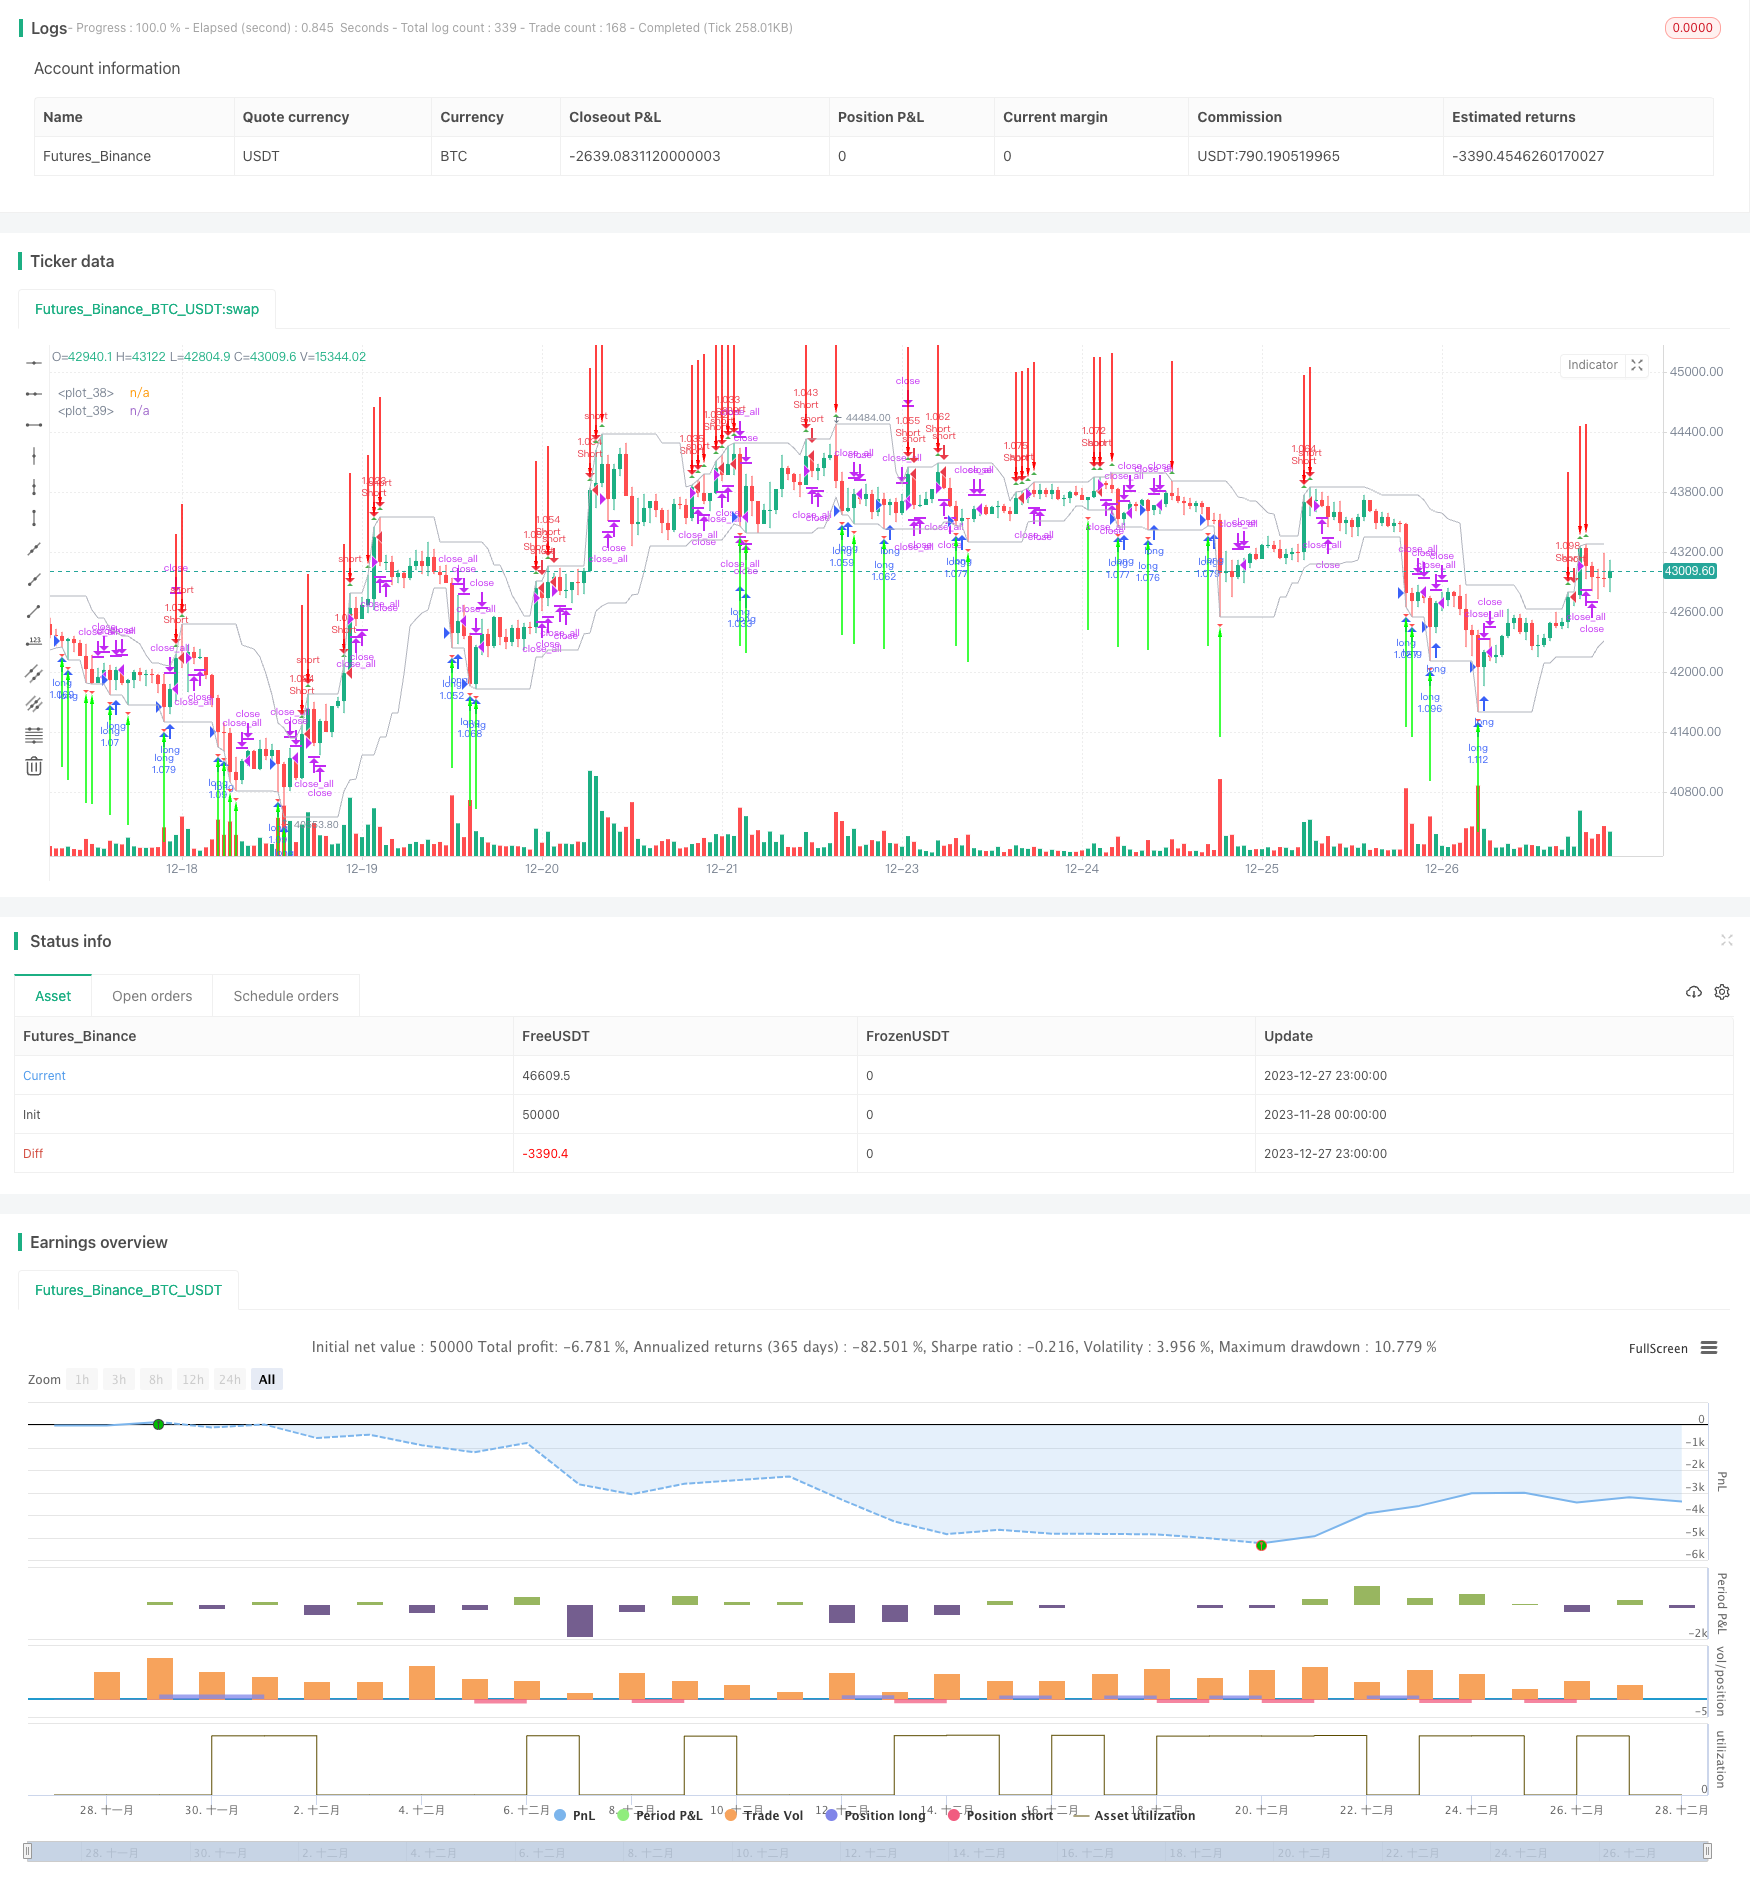
/*backtest
start: 2023-11-28 00:00:00
end: 2023-12-28 00:00:00
period: 1h
basePeriod: 15m
exchanges: [{"eid":"Futures_Binance","currency":"BTC_USDT"}]
*/

//Noro
//2018

//@version=2
strategy("Noro's Transient Zones Strategy v1.0", shorttitle = "TZ str 1.0", overlay=true, default_qty_type = strategy.percent_of_equity, default_qty_value = 100, pyramiding = 0)

//Settings
needlong = input(true, defval = true, title = "Long")
needshort = input(true, defval = true, title = "Short")
capital = input(100, defval = 100, minval = 1, maxval = 10000, title = "Capital, %")

usecol = input(true, defval = true, title = "Use Color-Filter")
usebod = input(true, defval = true, title = "Use Body-Filter")

h_left = input(title = "H left", defval = 10)
h_right = -1
sample_period = input(title = "Sample bars for % TZ",  defval = 5000)
show_ptz = input(title = "Show PTZ", type = bool, defval = true)
show_channel = input(title = "Show channel", type = bool, defval = true)

fromyear = input(2018, defval = 2018, minval = 1900, maxval = 2100, title = "From Year")
toyear = input(2100, defval = 2100, minval = 1900, maxval = 2100, title = "To Year")
frommonth = input(01, defval = 01, minval = 01, maxval = 12, title = "From Month")
tomonth = input(12, defval = 12, minval = 01, maxval = 12, title = "To Month")
fromday = input(01, defval = 01, minval = 01, maxval = 31, title = "From day")
today = input(31, defval = 31, minval = 01, maxval = 31, title = "To day")

//By Jurij w/ TZ percent occurrence by SPYderCrusher

//barCount = nz(barCount[1]) + 1
//check history and realtime PTZ
h_left_low = lowest(h_left)
h_left_high = highest(h_left)
newlow = low <= h_left_low
newhigh = high >= h_left_high
plotshape(newlow and show_ptz, style=shape.triangledown, location=location.belowbar, color=red)
plotshape(newhigh and show_ptz, style=shape.triangleup, location=location.abovebar, color=green)
channel_high = plot(show_channel ? h_left_low : 0, color=silver)
channel_low = plot (show_channel ? h_left_high : 0, color=silver)

//check true TZ back in history
central_bar_low = low[h_right + 1]
central_bar_high = high[h_right + 1]
full_zone_low = lowest(h_left + h_right + 1)
full_zone_high = highest(h_left + h_right + 1)
central_bar_is_highest = central_bar_high >= full_zone_high
central_bar_is_lowest = central_bar_low <= full_zone_low
plotarrow(central_bar_is_highest ? -1 : 0, offset=-h_right-1)
plotarrow(central_bar_is_lowest ? 1 : 0, offset=-h_right-1)

//Color Filter
bar = close > open ? 1 : close < open ? -1 : 0

//Body Filter
nbody = abs(close - open)
abody = sma(nbody, 10)
body = nbody > abody / 3 or usebod == false

//Signals
up1 = central_bar_is_lowest and body and (bar == -1 or usecol == false)
dn1 = central_bar_is_highest and body and (bar == 1 or usecol == false)
exit = ((strategy.position_size > 0 and close > open) or (strategy.position_size < 0 and close < open)) and body

//Trading
lot = strategy.position_size == 0 ? strategy.equity / close * capital / 100 : lot[1]

if up1
    if strategy.position_size < 0
        strategy.close_all()

    strategy.entry("long", strategy.long, needlong == false ? 0 : lot, when=(time > timestamp(fromyear, frommonth, fromday, 00, 00) and time < timestamp(toyear, tomonth, today, 23, 59)))

if dn1
    if strategy.position_size > 0
        strategy.close_all()

    strategy.entry("Short", strategy.short, needshort == false ? 0 : lot, when=(time > timestamp(fromyear, frommonth, fromday, 00, 00) and time < timestamp(toyear, tomonth, today, 23, 59)))

if time > timestamp(toyear, tomonth, today, 23, 59) or exit
    strategy.close_all()