BankNifty Supertrend Trading Strategy

Overview
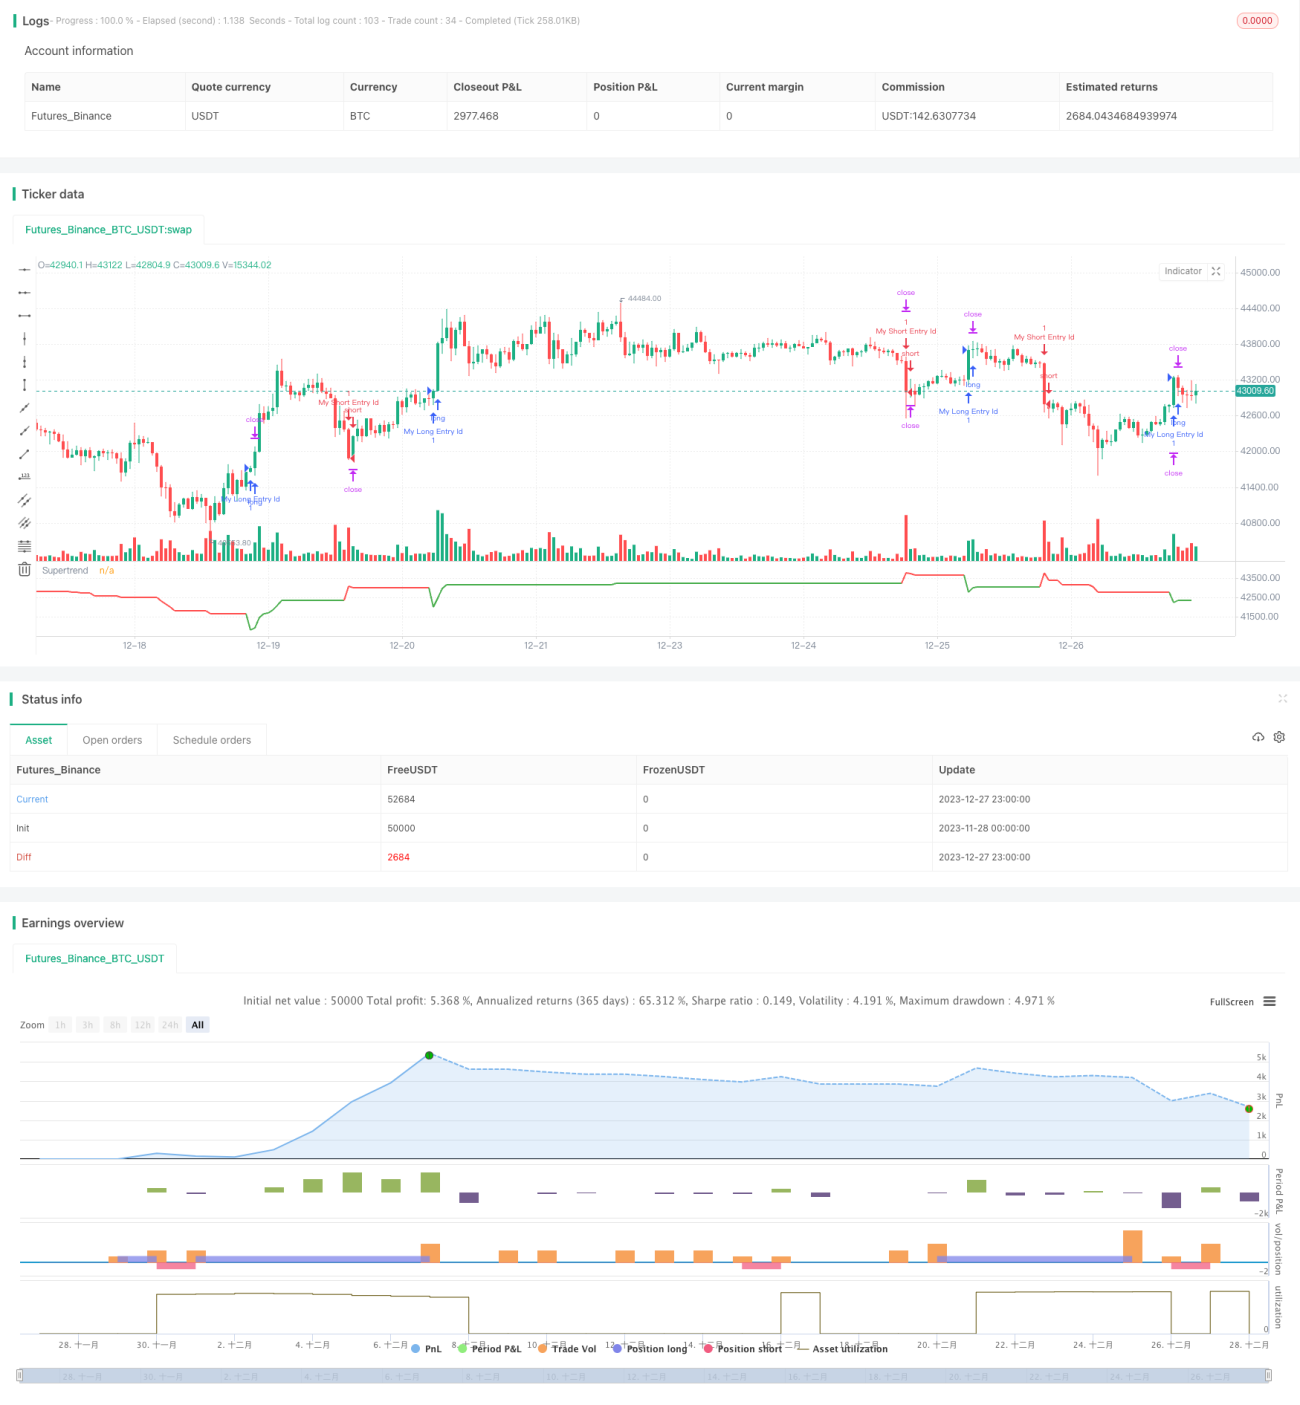
This is a trading strategy based on the 5-minute K-line of BankNifty using the Supertrend indicator. The strategy mainly utilizes the Supertrend indicator to identify trends and combines trading sessions and risk management rules to trade.
Strategy Principle
The strategy first defines input variables such as trading sessions and date ranges. The trading session is set to the Indian trading session from 9:15 am to 3:10 pm.
It then calculates the Supertrend indicator and its direction. The Supertrend indicator can identify the direction of the trend.
At the beginning of each trading session, the strategy waits for 3 candles to form before considering entering a trade. This is to filter false breakouts.
The long signal is when the Supertrend indicator direction changes from down to up; the short signal is when the Supertrend direction changes from up to down.
After entering, stop loss will be set. Both fixed stop loss points and trailing stop loss percentage can be adjusted through input variables.
At the end of the trading session, the strategy will close all open positions.
Advantages of the Strategy
This is a simple trading strategy that uses indicators to identify trends. It has the following advantages:
- Use Supertrend indicator to judge trend direction, which can effectively identify trends
- Combining trading sessions can avoid the most volatile opening and closing session
- Set trailing stop loss to lock in profits
- Many parameters can be adjusted freely through input variables, high adaptability
Risks of the Strategy
The strategy also has some risks:
- Supertrend indicator has lagging, may miss the best entry point
- Single indicator judgment is prone to be affected by false breakouts, win rate may be low
- Does not consider market trend, may diverge from the overall market
- Improper stop loss setting may lead to larger than expected losses
These risks can be reduced by optimizing parameters of the Supertrend indicator or adding other indicator judgments.
Optimization Directions
The strategy can also be optimized in the following aspects:
- Add other indicator judgments to form a combined strategy, improve stability
- Add overall market trend judgment to avoid divergence from the market
- Optimize parameters of Supertrend indicator, find the best length and factor
- Adjust stop loss strategy, like trailing stop loss along with the trend
- Test on different products, find the best match
Conclusion
In summary, this is a Supertrend indicator trading strategy based on the BankNifty 5-minute chart. It utilizes the Supertrend indicator to determine the trend direction and combines trading sessions and risk management rules to trade. Compared to complex quantitative strategies, this strategy has simple and clear rules that are easy to understand and implement. As a sample strategy, it provides a foundation and direction for future optimization and improvement. Through continuous refinement and enhancement, it is hoped that the strategy can become a reliable and profitable quantitative trading strategy.
/*backtest
start: 2023-11-28 00:00:00
end: 2023-12-28 00:00:00
period: 1h
basePeriod: 15m
exchanges: [{"eid":"Futures_Binance","currency":"BTC_USDT"}]
*/

//@version=5
strategy("BankNifty 5min Supertrend Based Strategy, 09:15 Entry with Date Range and Risk Management")

// Session and date range input variables- 1