资源加载中... loading...

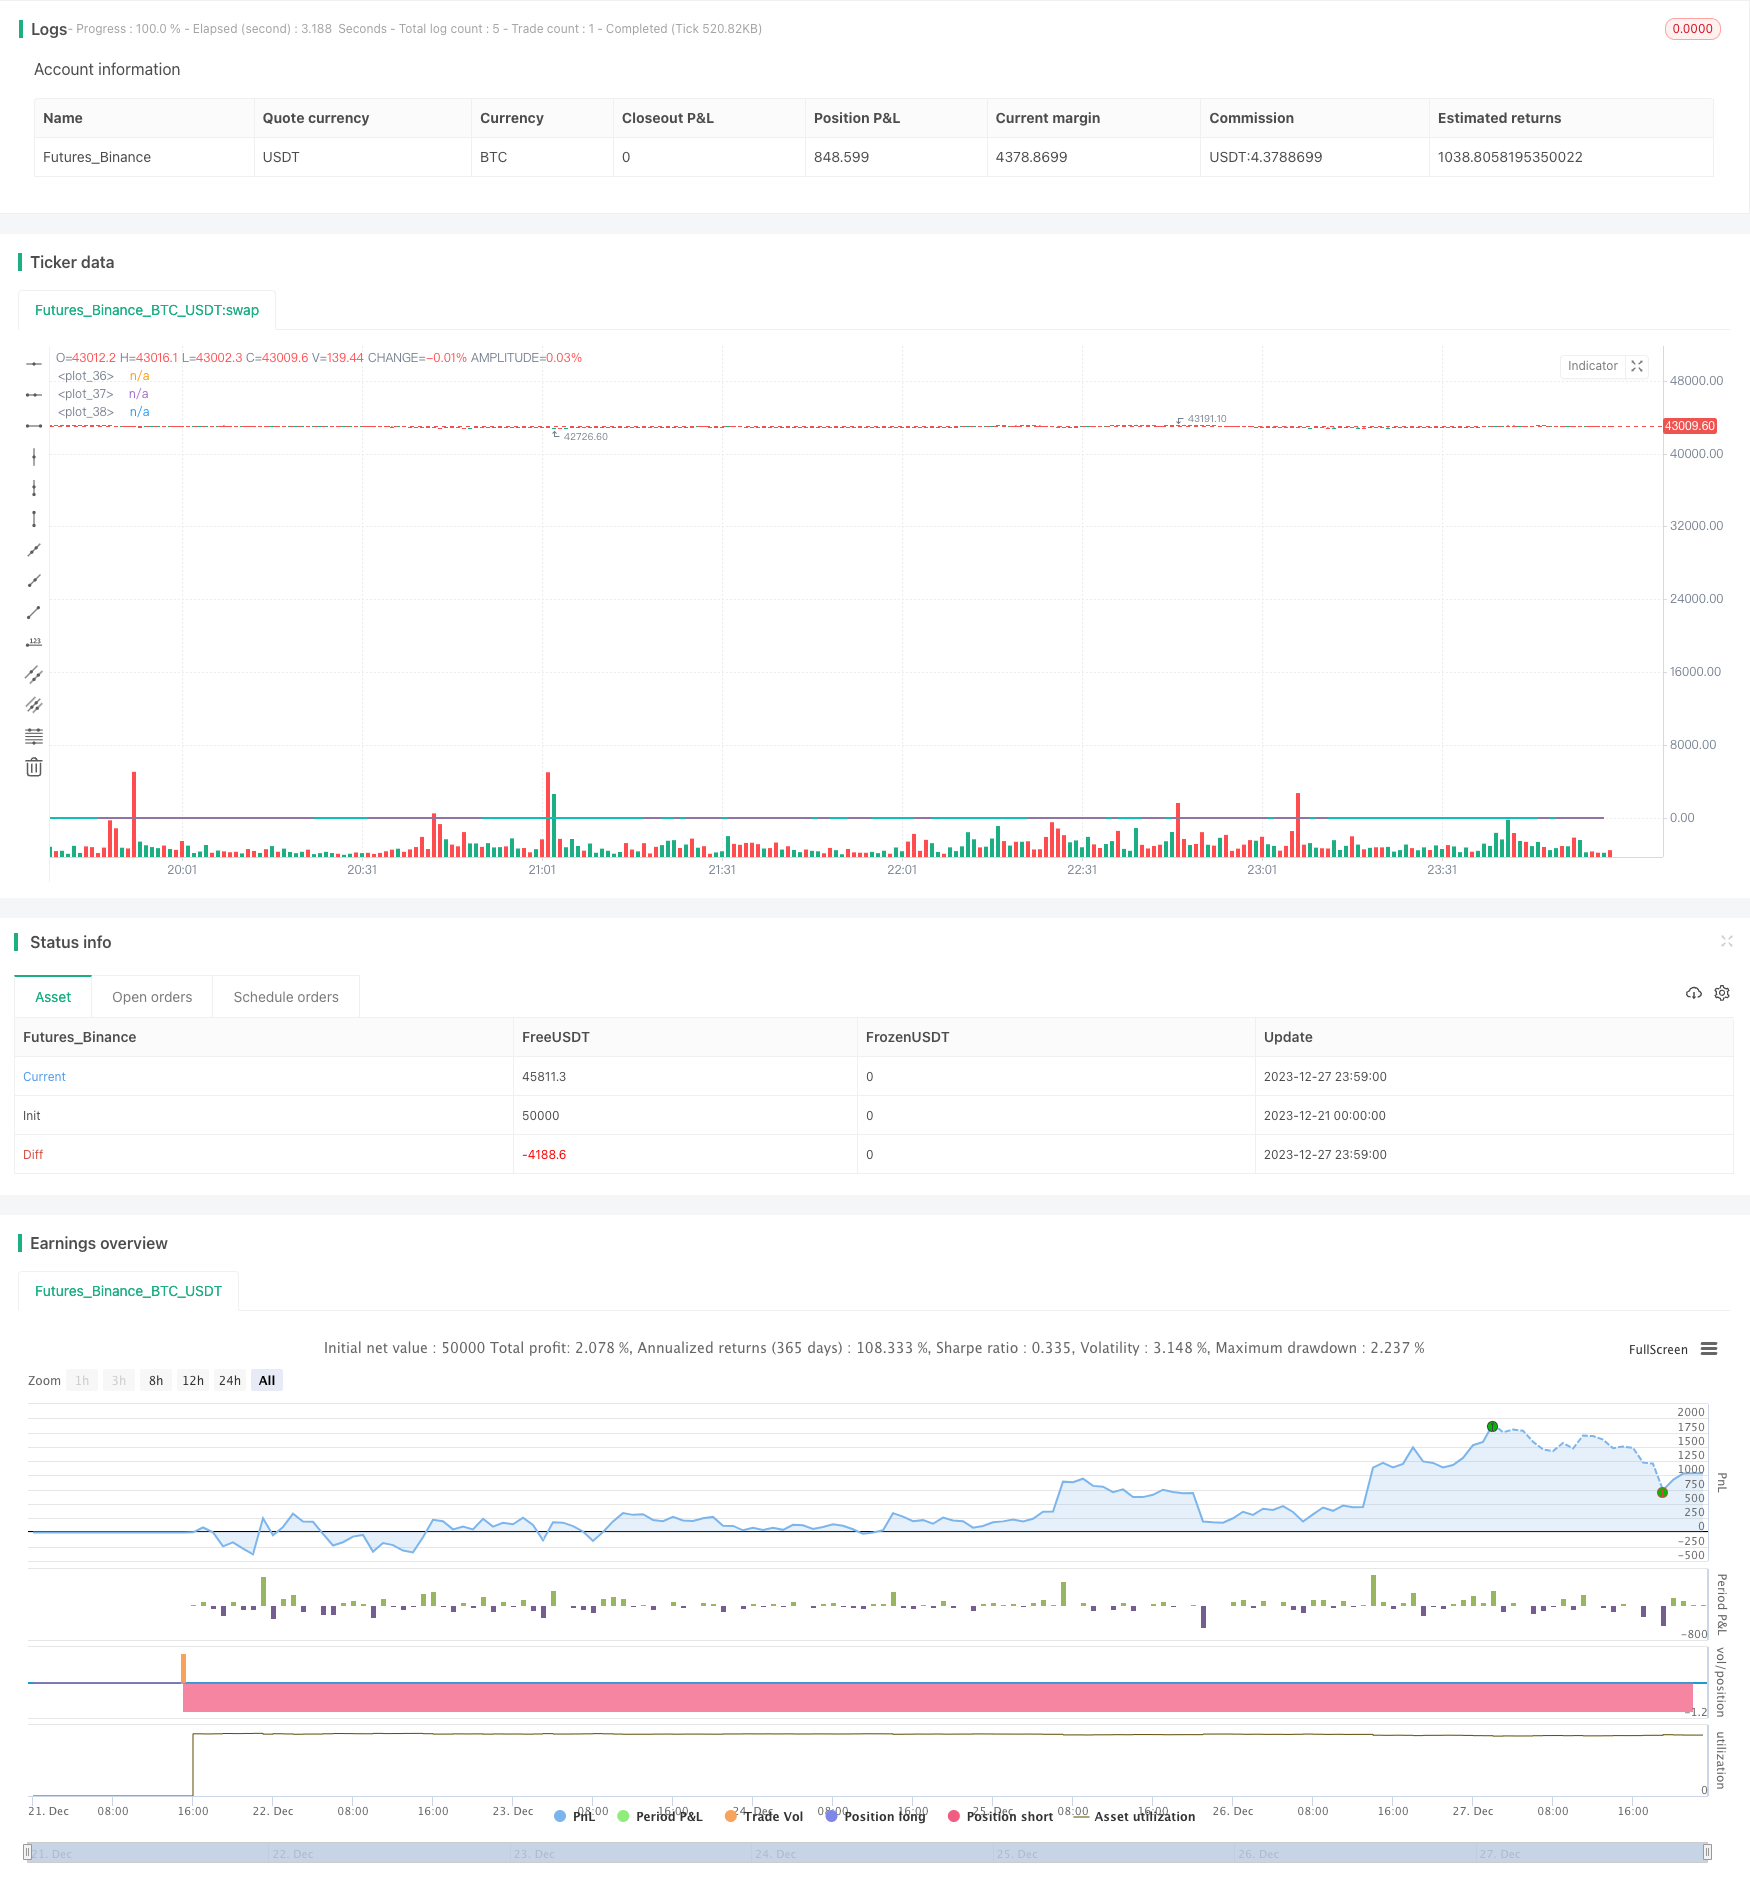
Transitive Ratio Trading Strategy Based on Kalman Filter and Mean Reversion

Author: ChaoZhang, Date: 2023-12-29 17:23:14
Tags:

img

Overview

This strategy utilizes the concepts of Kalman filter and mean reversion to capture abnormal short-term fluctuations in stock prices and implement directional trading of stocks. The strategy first establishes a price ratio model between a stock and a market index, and then uses the Kalman filter technique to predict and filter the ratio. Trading signals are generated when the ratio deviates from normal levels. In addition, the strategy also incorporates volume filtering to avoid false trades.

Strategy Principle

The core idea of the strategy is to establish a price ratio model between the price of the stock itself and the price of the market index. This ratio reflects the price level of individual stocks relative to the overall market. When the ratio is high, it is considered that the individual stock is overvalued and a sell signal is generated. When the ratio is low, it is considered that the individual stock is undervalued and a buy signal is generated.

In order to filter the ratio signal smoothly, the strategy adopts the Kalman filter algorithm. The Kalman filter weights the actual observed value of the ratio with the predicted value and updates the prediction of the ratio in real time. And calculate a smooth Kalman filter value. Trading signals are generated when the filtered value exceeds 2 standard deviations above or below normal levels.

In addition, the strategy also considers trading volume factors. Real trading signals are only generated when trading volume is large. This avoids some false trades.

Advantage Analysis

The biggest advantage of this strategy is the effective smoothing and prediction of the price ratio using the Kalman filter algorithm. Compared with simple mean reversion models, the Kalman filter can better reflect the dynamic changes in prices, especially when prices fluctuate sharply. This allows the strategy to detect price anomalies in a timely manner and generate accurate trading signals.

Secondly, the combination of trading volume also enhances the practical applicability of the strategy. Reasonable trading volume filtering helps avoid some erroneous signals and reduces unnecessary trading costs.

Overall, the strategy successfully combines Kalman filtering, mean reversion, trading volume analysis and other techniques to form a robust quantitative trading strategy.

Risk Analysis

Although the strategy is theoretically and technically sound, there are still some potential risks in actual use that need attention.

The first is model risk. Some key parameters in the Kalman filter model, such as process noise variance, observation noise variance, etc., need to be estimated based on historical data. If the estimation is inaccurate or there is a major change in market conditions, it will lead to deviation in model prediction.

Second is the risk of slippage costs. Frequent trading will incur higher slippage costs, which will erode strategy returns. Parameter optimization and transaction volume filtering can reduce unnecessary transactions to some extent.

Finally, there is some systemic market risk in following the market index as a benchmark. When the entire market fluctuates sharply, the price ratio between individual stocks and the market will also be abnormal. The strategy will then generate wrong signals. We can consider choosing a more stable index as the benchmark.

Optimization Directions

There is room for further optimization of the strategy:

  1. Use more complex deep learning models to fit and predict price ratios. This can improve model accuracy and robustness.

  2. Optimize trading volume filtering rules to achieve more dynamic and intelligent threshold settings. This reduces the probability of false trades.

  3. Test different market indexes as strategy benchmarks and choose indexes with smaller and more stable fluctuations. This reduces the impact of market systemic risk.

  4. Incorporate fundamental analysis of stocks to avoid trading some stocks with significantly deteriorated fundamentals. This screens for higher quality trading targets.

  5. Use high-frequency intraday data for strategy backtesting and optimization. This improves real trading performance of the strategy.

Conclusion

The strategy successfully captures abnormal short-term price fluctuations in stocks using the Kalman filter model. Meanwhile, the introduction of volume signals also enhances the practicality of the strategy. Although there are still some model risks and market risks, this is a very promising quantitative trading strategy. There is great room for improvement and application potential in future model and signal optimization.


/*backtest
start: 2023-12-21 00:00:00
end: 2023-12-28 00:00:00
period: 1m
basePeriod: 1m
exchanges: [{"eid":"Futures_Binance","currency":"BTC_USDT"}]
*/

// This source code is subject to the terms of the Mozilla Public License 2.0 at https://mozilla.org/MPL/2.0/
// © xXM3GAXx

//@version=5
strategy("My strategy", overlay=true)

//SPY or QQQ
context = request.security("BTC_USDT:swap", timeframe.period, input(close))
//our stock
particular = input(close)

//ratio
src = ta.roc(particular, 1) / math.abs(ta.roc(context, 1))

//kalman calculation
Sharpness = input.float(1.0)
K = input.float(1.0)


greencolor =  color.lime
redcolor =  color.red

velocity = 0.0
kfilt = 0.0

Distance = src - nz(kfilt[1], src)
Error = nz(kfilt[1], src) + Distance * math.sqrt(Sharpness*K/ 100)
velocity := nz(velocity[1], 0) + Distance*K / 100
kfilt := Error + velocity

//2 std devs up and down
upper = kfilt[1] + 2 * ta.stdev(kfilt, input(20))
lower = kfilt[1] - 2 * ta.stdev(kfilt, input(20))

//plotting for visuals
plot(kfilt, color=velocity > 0 ? greencolor : redcolor, linewidth = 2)
plot(upper)
plot(lower)
//plot(ta.ema(ta.roc(particular, 1)/ta.roc(context, 1), 5), color = #00ffff, linewidth=2)

//volume data
vol = volume
volema = ta.ema(volume, 10)

//buy when ratio too low
longCondition = kfilt<=lower and vol>=volema
if (longCondition)
    strategy.entry("My Long Entry Id", strategy.long)

//sell when ratio too high
shortCondition = kfilt>=upper and vol>=volema
if (shortCondition)
    strategy.entry("My Short Entry Id", strategy.short)

template: strategy.tpl:40:21: executing "strategy.tpl" at <.api.GetStrategyListByName>: wrong number of args for GetStrategyListByName: want 7 got 6