概述
该策略是一个基于动态计算的趋势突破策略。它会实时跟踪股票的最高价和最低价,当价格突破最近一个周期的最高价时,会进入做多;当价格跌破最近一个周期的最低价时,会进入做空。同时,策略还会设置止损和止盈,以控制风险和确保固定的盈亏比。
策略原理
该策略的核心逻辑是跟踪并交易价格的趋势突破点。具体来说,策略会计算最近20天的最高价highestHigh和最低价lowestLow。当今天的收盘价超过前一天的highestHigh时,认为是一个向上趋势的突破点,这时会做多;当今天的收盘价低于前一天的lowestLow时,认为是一个向下趋势的突破点,这时会做空。
做多做空后,策略会设置1%的止损和2%的止盈。这保证了每个交易的盈亏比固定为2:1。这样可以有效控制单笔交易的风险。
策略优势
该策略最大的优势在于迅速抓住价格趋势的转折点,同时控制了单笔交易的风险。具体来说,主要有以下几个优势:
动态计算最高价和最低价,实时跟踪价格变化趋势,可以快速捕捉到价格反转的信号。
采用突破方式建仓,可以减少假信号,提高 entry 的质量。
设置止盈止损、控制单笔交易盈亏比,有效控制单笔交易的风险。
简单容易理解的逻辑,适合量化初学者实践。
代码量少,容易进行测试和优化。
策略风险
该策略也存在一些风险需要注意:
跟随趋势建仓,可能错过价格反转的最佳点位。
设置固定的止损止盈难以适应市场的变化,可能预先止损或止盈。
Strat后期没有设置层叠进场和加仓的逻辑,无法持续跟踪趋势。
没有考虑大周期的趋势判断,可能与大趋势错位造成损失。
没有设置资金管理模块,无法控制整体的仓位管理。
策略优化方向
该策略还具有很大的优化空间,主要的优化方向包括:
增加动态止损止盈设定,可以根据市场波动程度来调整止损止盈。
增加基于均线方向的过滤条件,避免与大趋势打架。
增加趋势强度指标判断,确保只在趋势足够强劲时建仓。
添加续单加码逻辑,跟踪趋势,使利润最大化。
结合资金管理模块,可以动态调整仓位,控制整体的风险。
优化参数,寻找最佳的参数组合。
总结
该策略整体来说是一个非常适合量化初学者学习和实践的趋势突破策略。它的优势在于简单、易于理解,同时加入了止损止盈逻辑来控制风险。但也还有很多可优化的地方,可以作为进一步学习的契机。总的来说,该策略从原理到应用都比较适合新手掌握。
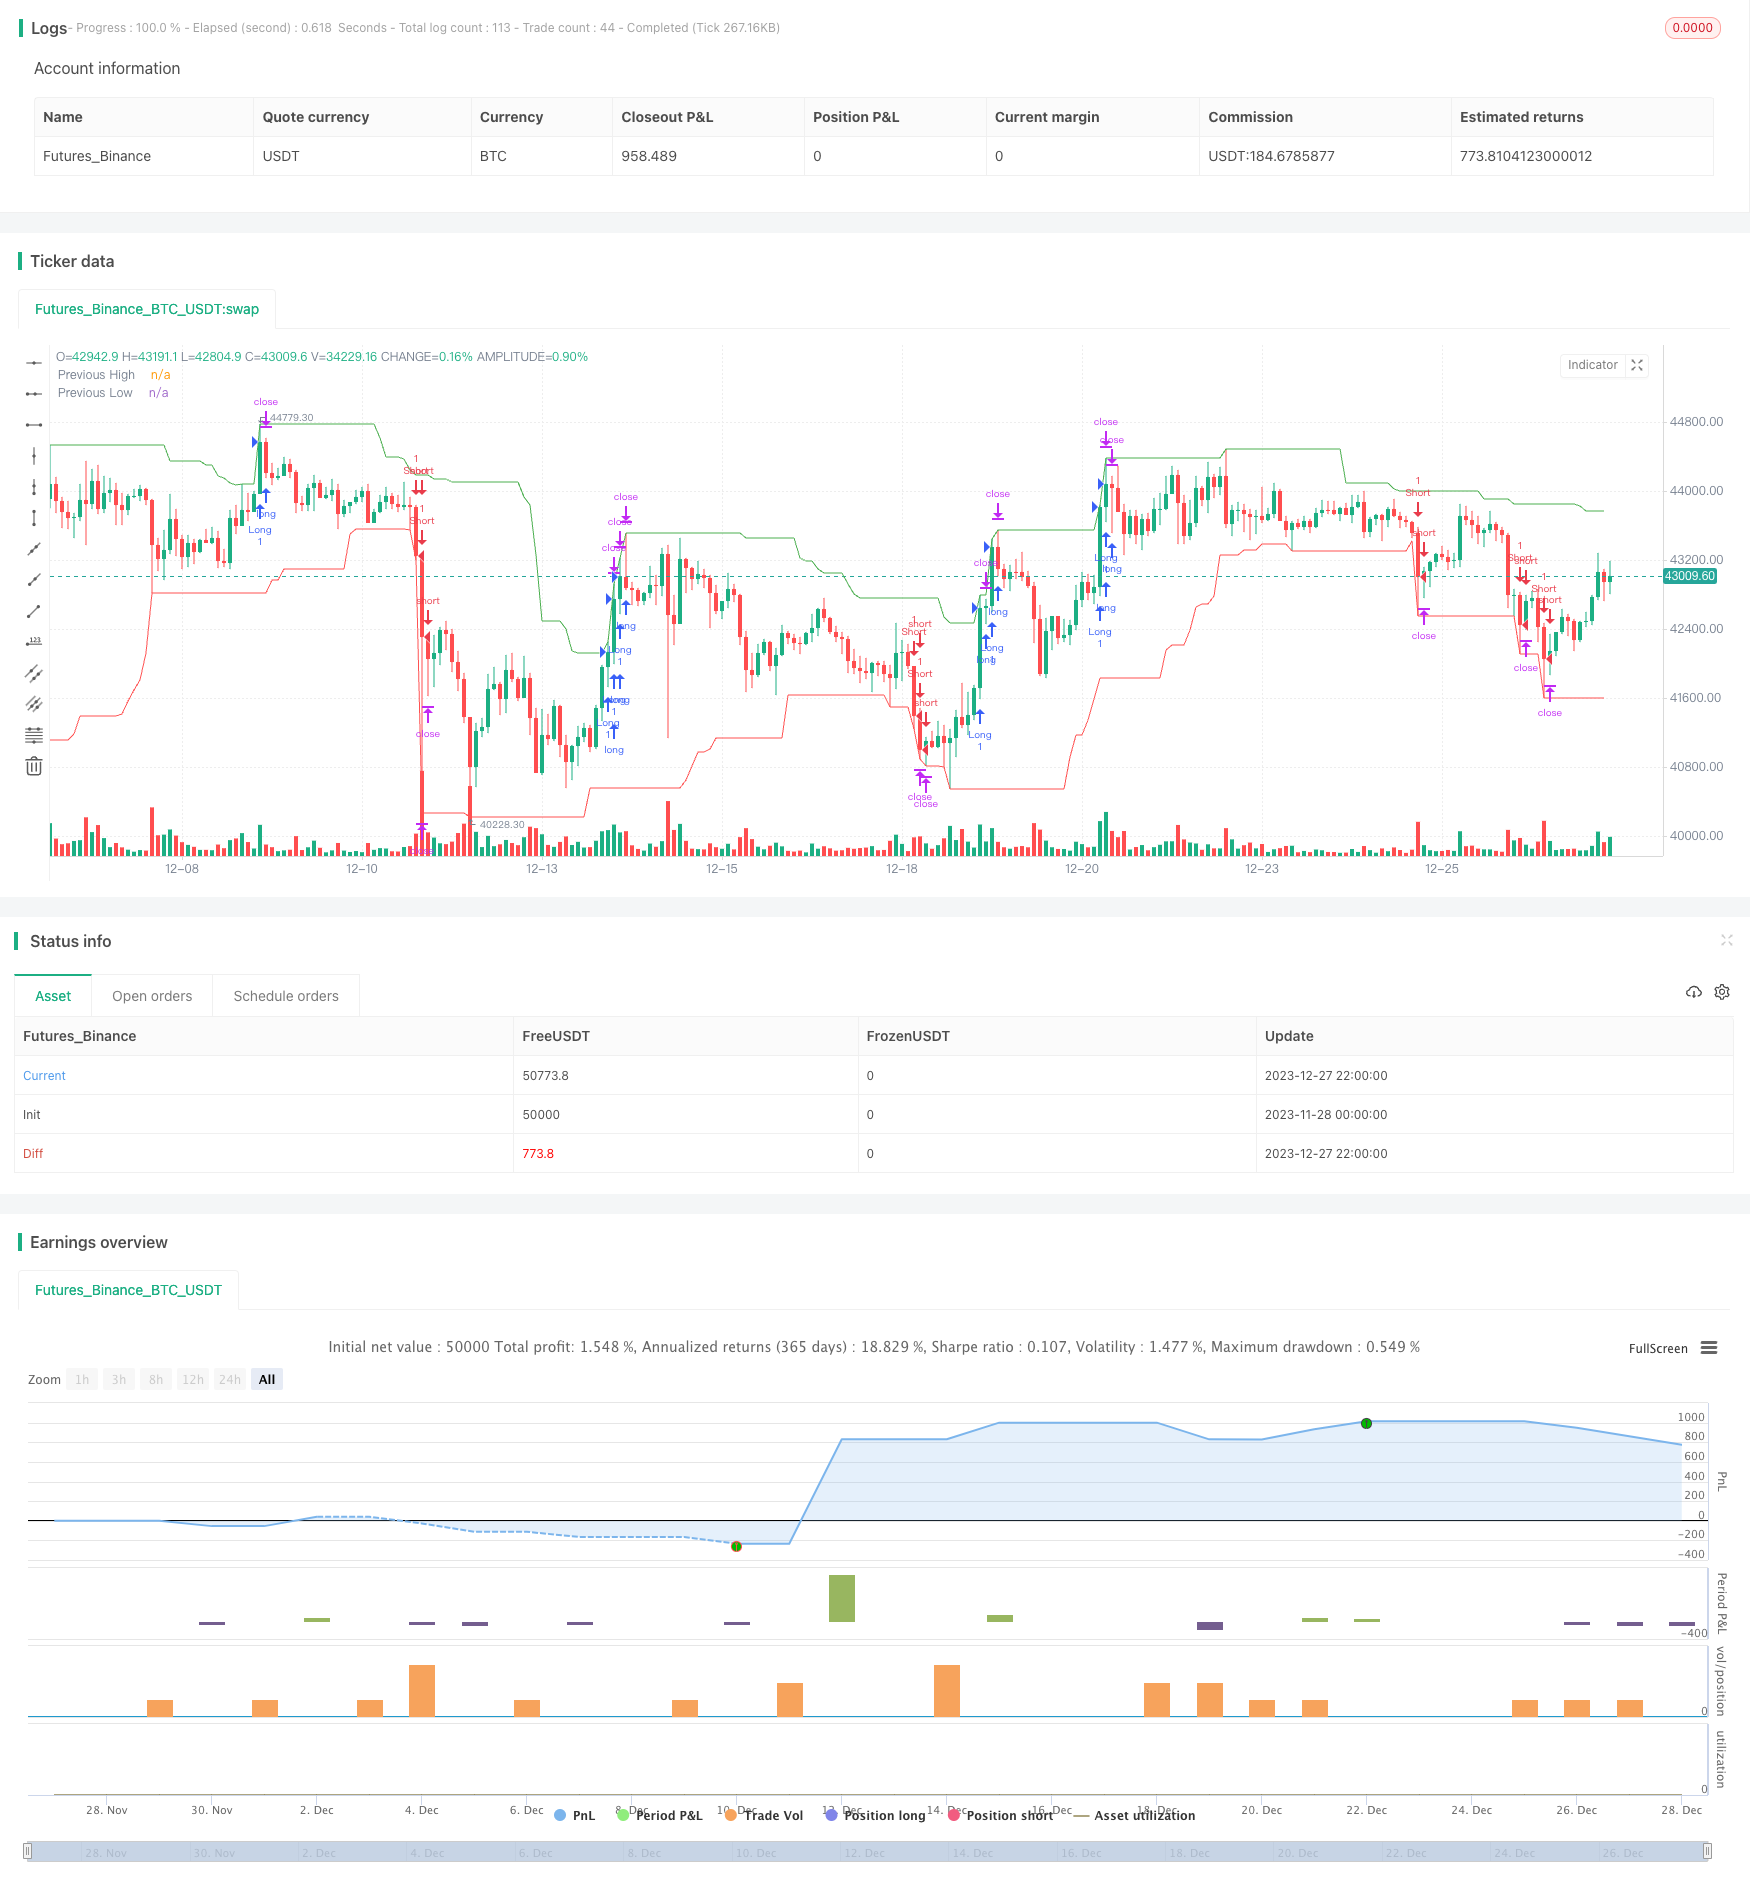
/*backtest
start: 2023-11-28 00:00:00
end: 2023-12-28 00:00:00
period: 2h
basePeriod: 15m
exchanges: [{"eid":"Futures_Binance","currency":"BTC_USDT"}]
*/

//@version=4
strategy("Trend Following Breakout Strategy with 2:1 RRR", overlay=true)

// 定义前高和前低的计算
length = input(20, minval=1, title="Length")
highestHigh = highest(high, length)
lowestLow = lowest(low, length)

// 定义买入和卖出的条件
longCondition = close > highestHigh[1] // 当前收盘价高于前一期的最高价
shortCondition = close < lowestLow[1] // 当前收盘价低于前一期的最低价

// 为了确保盈亏比为2:1,我们需要定义止损和目标价
stopLoss = input(1, title="Stop Loss %") / 100
takeProfit = stopLoss * 2

// 如果满足买入条件,进入多头
if (longCondition)
    strategy.entry("Long", strategy.long)
    strategy.exit("Long TP", "Long", profit=takeProfit * close, loss=stopLoss * close)

// 如果满足卖出条件,进入空头
if (shortCondition)
    strategy.entry("Short", strategy.short)
    strategy.exit("Short TP", "Short", profit=takeProfit * close, loss=stopLoss * close)

// 绘图显示前高和前低
plot(highestHigh, color=color.green, title="Previous High")
plot(lowestLow, color=color.red, title="Previous Low")