概述
本策略基于动态均线指标,实现对价格趋势的实时跟踪,通过均线的突破来发出交易信号。策略优点是参数设置简单,信号判断清晰,适合中长线持仓。
策略原理
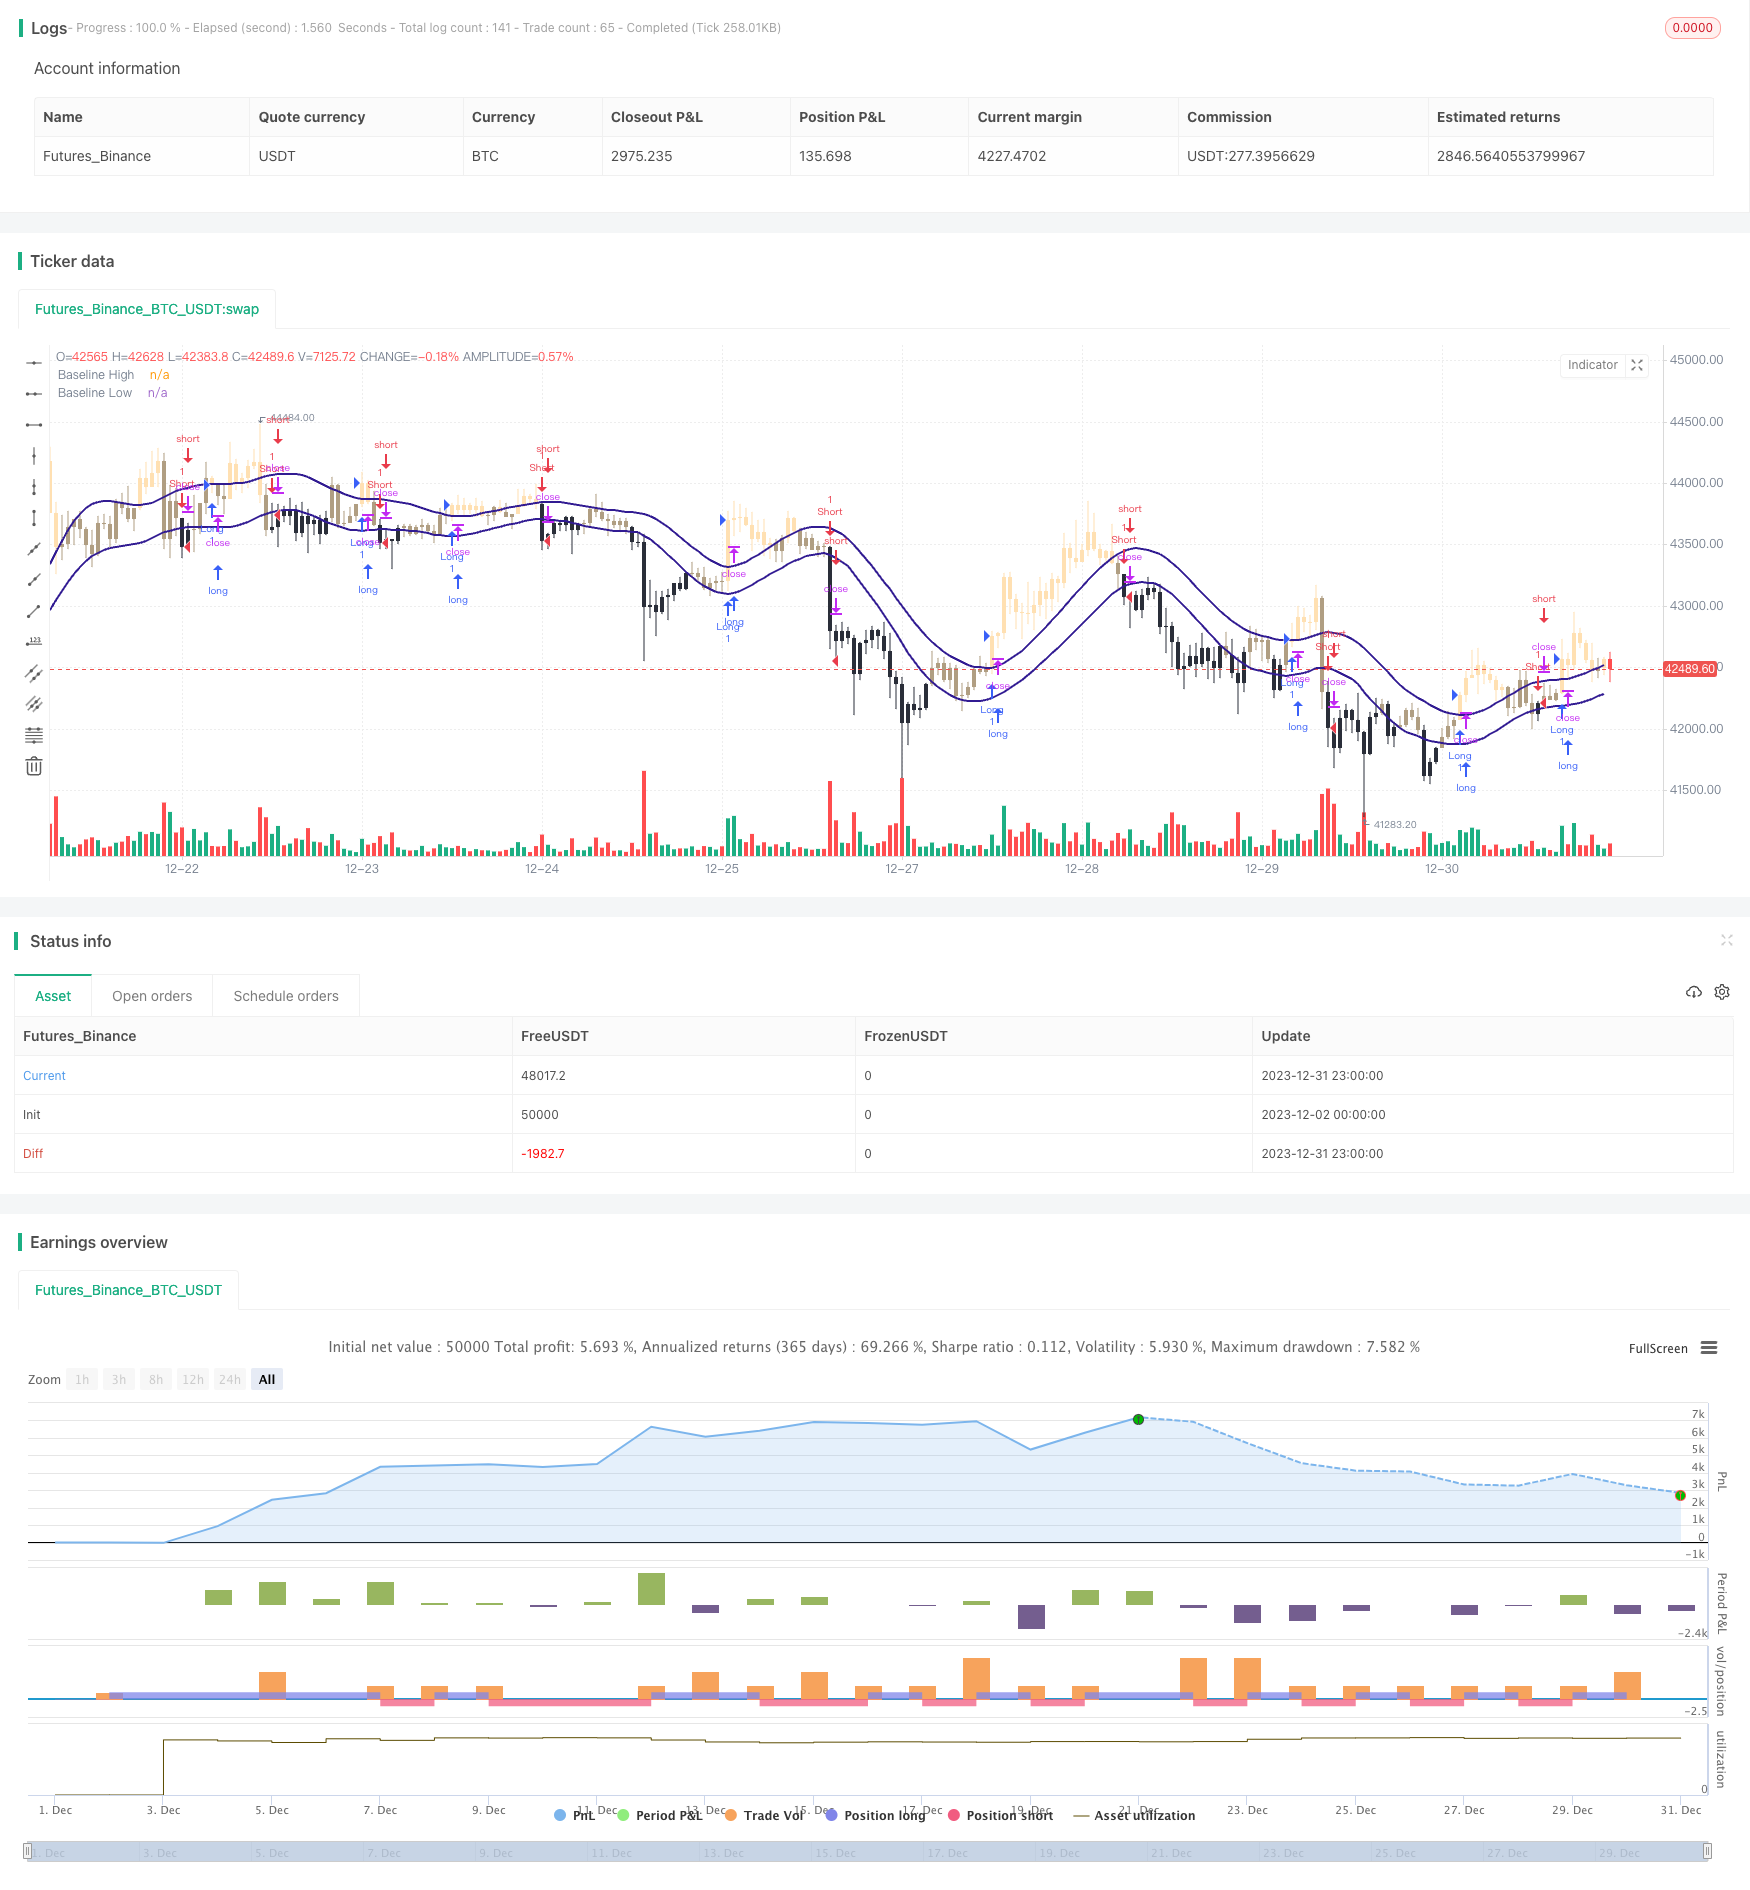
该策略使用动态均线指标,包括ALMA、EMA、SMA等多种类型的均线。基本原理是,当价格上穿均线时,做多;当价格下穿均线时,做空。即以均线作为价格趋势的晴雨表,发生方向转换时就可发出交易信号。
具体来说,策略使用高低点形成的均线,然后把低点均线作为做多信号线,把高点均线作为做空信号线。当收盘价高于低点均线时,做多;当收盘价低于高点均线时,做空。
这样利用均线指标判断价格趋势,再结合突破原理发出信号,形成一个简单实用的趋势跟踪策略。
策略优势
- 使用均线指标判断,参数设置简单,容易操作
- 信号判断规则清晰,不会产生假信号
- 可自由选择均线算法,灵活应对市场变化
- 可调整均线参数,适应不同周期的趋势
- 可在多时间框架下验证信号,提高可靠性
风险及解决
- 均线指标滞后,可能错过部分机会
- 适当缩短均线周期,或使用指数移动平均线EMA
- 短期内震荡较大,停损风险
- 适当放宽止损幅度,确保有足够的机动空间
- 长期持有风险,可能无法及时止盈
- 结合其它指标判断,避免追高杀跌
策略优化
- 根据不同品种特点,调整均线算法及参数
- 增加副指标判断,提高策略效果
- 增加止损止盈机制
- 评估多时间框架下信号可靠性
- 结合机器学习技术寻找更优参数
总结
该策略利用均线指标判断价格趋势方向,基于突破理论发出交易信号。优点是简单易用,适合中长线持仓,可通过参数调整适应市场变化。需要注意防范短期震荡和长期持有带来的风险,可通过止损止盈来解决。有优化空间在于利用更多指标提高策略效果,以及运用机器学习寻找更优参数。
策略源码
/*backtest
start: 2023-12-02 00:00:00
end: 2024-01-01 00:00:00
period: 1h
basePeriod: 15m
exchanges: [{"eid":"Futures_Binance","currency":"BTC_USDT"}]
*/

//@version=4
strategy(title="Baseline Strategy - evo", shorttitle="Baseline", overlay=true)

//INPUTS
mat =               input("ALMA", "MA Type", options=["SMA", "EMA", "WMA", "HMA", "VWMA", "RMA", "ALMA"])
baseline =          input(55, title="MA Length")
src =               input(ohlc4, title="Closing Source")

offset =            input(0.85, step=0.05, title="Offset (alma only)")
sigma =             input(10, title="Sigma (alma only)")

useCurrentRes =     input(true, title="Use Current Resolution")
resCustom =         input("1440", title="Timeframe")

showsignals =       input(false, title="Show Signals ?")

//BASELINE
baselinehigh =

 mat=="SMA" ? sma(high,baseline) :
 mat=="EMA" ? ema(high,baseline) :
 mat=="WMA" ? wma(high,baseline) :
 mat=="HMA" ? wma(2*wma(high, baseline/2)-wma(high, baseline), round(sqrt(baseline))) :
 mat=="VWMA" ? vwma(high,baseline) :
 mat=="RMA" ? rma(high,baseline) :
 mat=="ALMA" ? alma(high, baseline, offset, sigma) : na

baselinelow =

 mat=="SMA" ? sma(low,baseline) :
 mat=="EMA" ? ema(low,baseline) :
 mat=="WMA" ? wma(low,baseline) :
 mat=="HMA" ? wma(2*wma(low, baseline/2)-wma(low, baseline), round(sqrt(baseline))) :
 mat=="VWMA" ? vwma(low,baseline) :
 mat=="RMA" ? rma(low,baseline) :
 mat=="ALMA" ? alma(low, baseline, offset, sigma) : na

//RESOLUTION
res =               useCurrentRes ? timeframe.period : resCustom

mtfhigh =           security(syminfo.tickerid, res, baselinehigh)
mtflow =            security(syminfo.tickerid, res, baselinelow)

//PLOTS
plot(mtfhigh, color=color.navy, linewidth=2, transp=0, title="Baseline High")
plot(mtflow, color=color.navy, linewidth=2, transp=0, title="Baseline Low")

long =              src > mtfhigh
short =             src < mtflow

barcolor(long ? #ffe0b2 : short ? #2a2e39 : not long and not short ? #b09e82 : na, title="BaseLine BarColor")

signal = 0
signal := long ? 1 : short ? 2 : nz(signal[1])

plotshape(showsignals ? (signal != signal[1] and long ? mtflow : na) : na, title="Long", location=location.absolute, size=size.small, style=shape.labelup, text="Long", textcolor=color.black, transp=40, color=#00ff00)
plotshape(showsignals ? (signal != signal[1] and short ? mtfhigh : na) : na, title="Short", location=location.absolute, size=size.small, style=shape.labeldown, text="Short", textcolor=color.white, transp=40, color=#ff0000)

alertcondition(signal != signal[1], title="Trend Change !", message="Trend Change !")

if (long)
    strategy.entry("Long", strategy.long)
if (short)
    strategy.entry("Short", strategy.short)