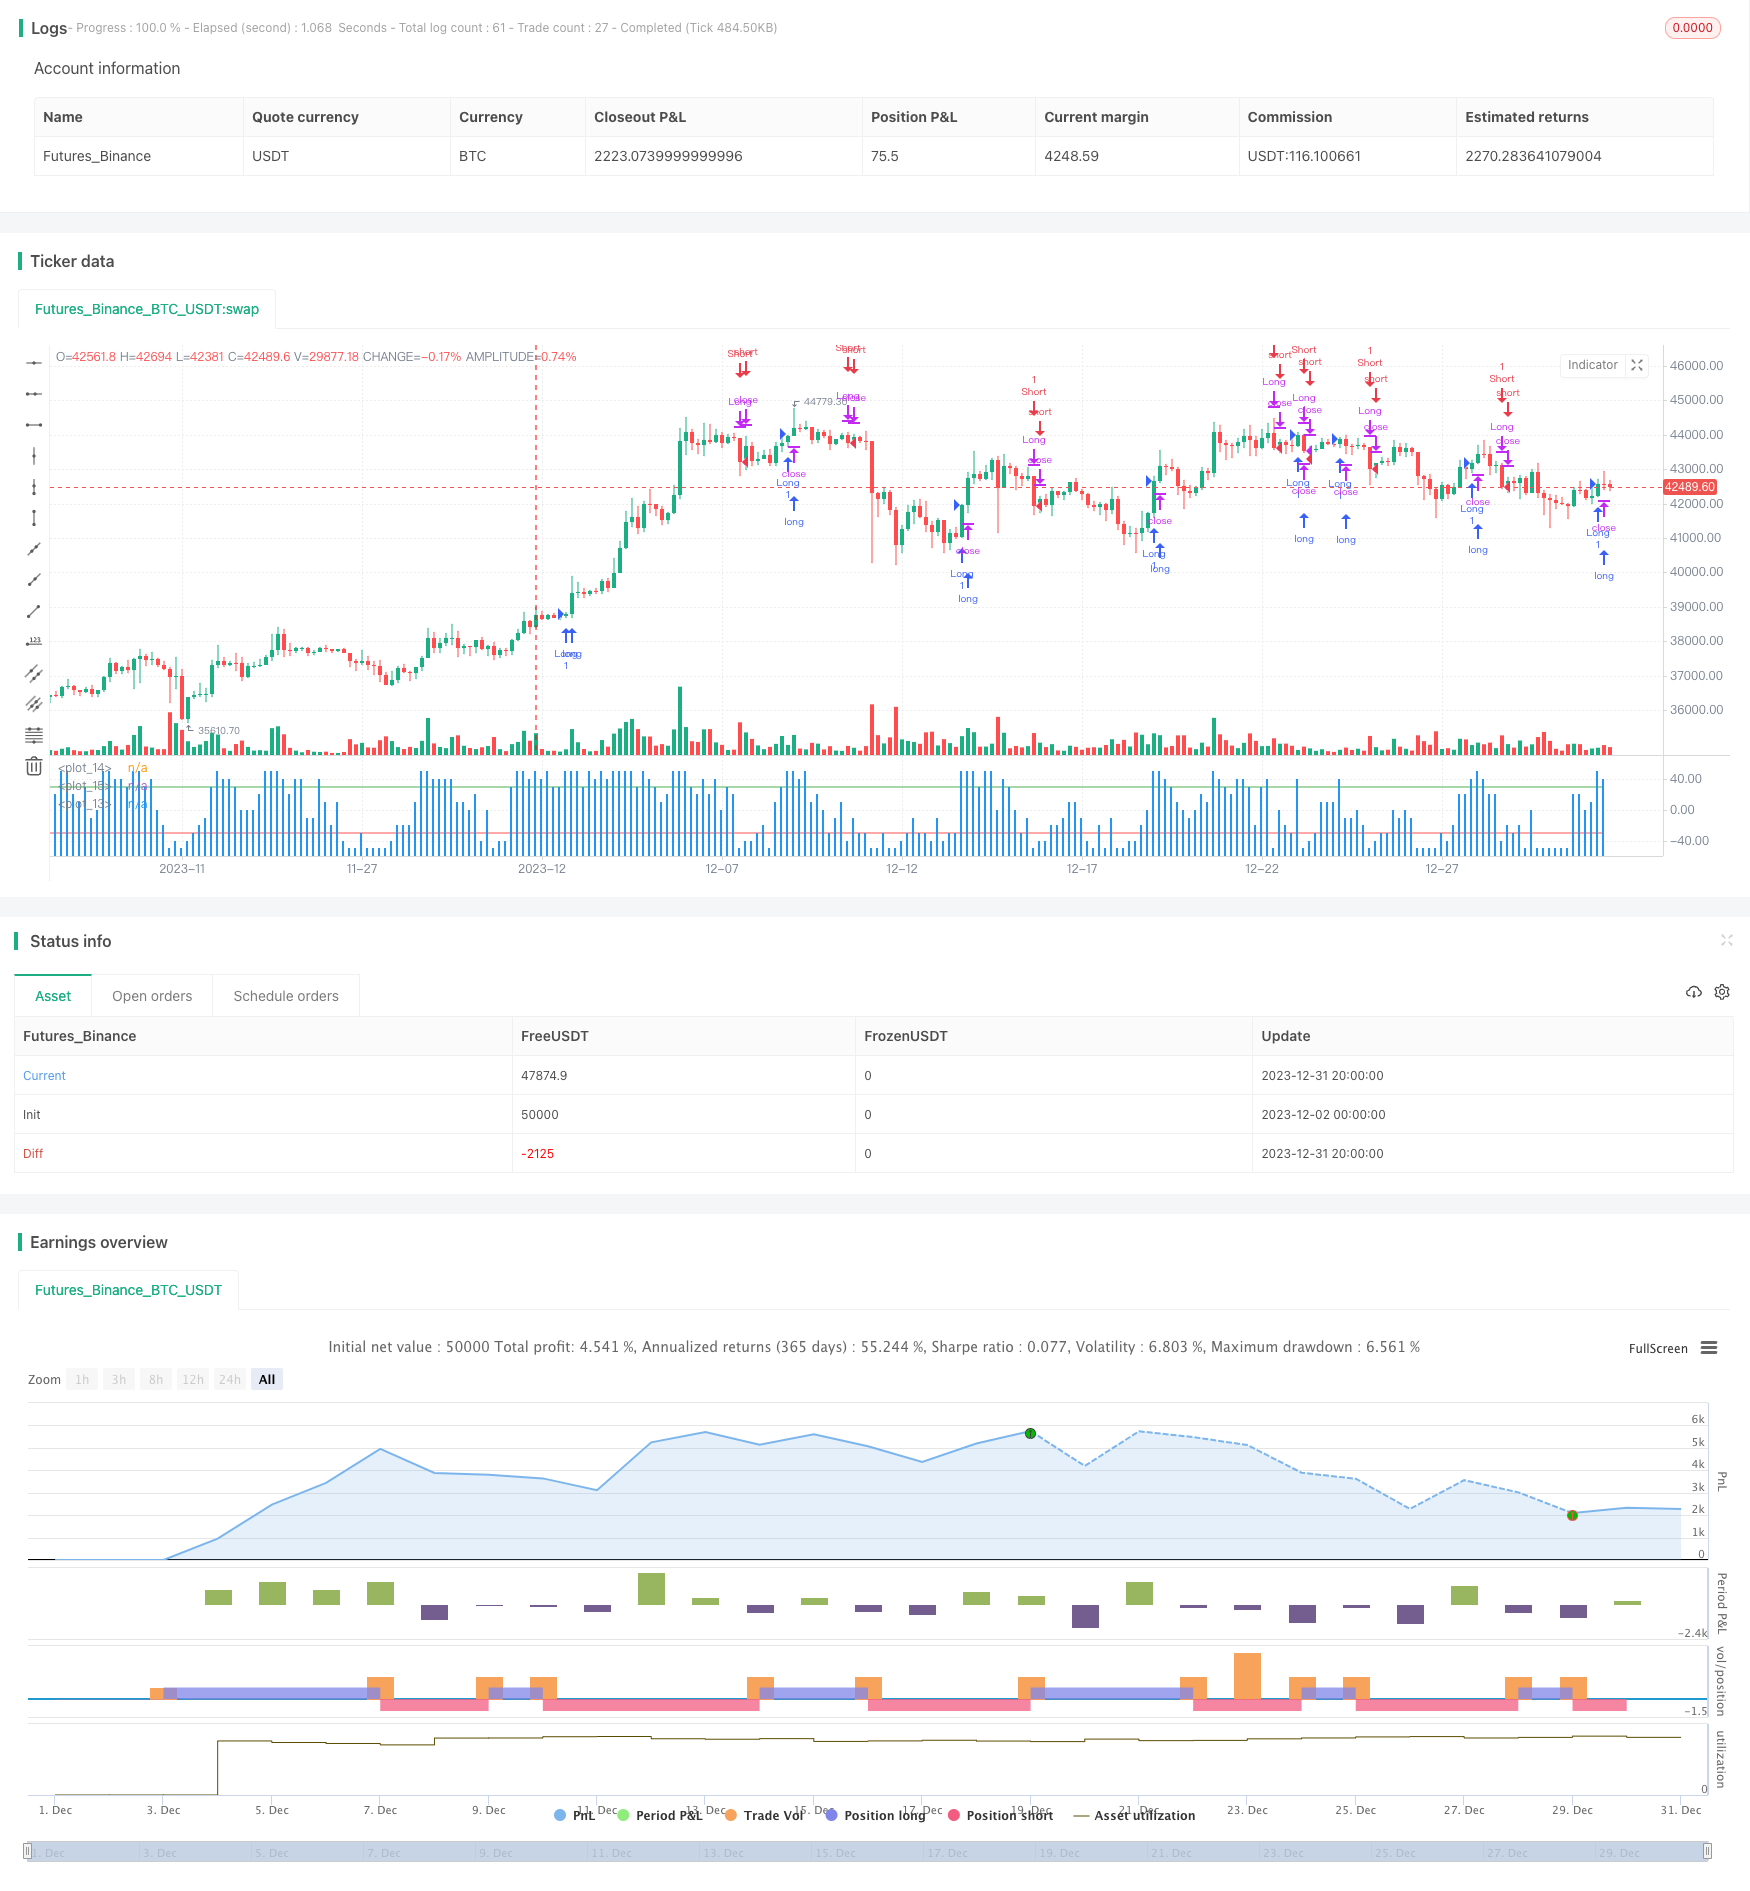
概述
本策略的主要思想是结合 percentrank 指标和参数优化,实现对价格趋势的判断和跟踪。该策略通过比较当前价格与一定历史周期内的价格大小百分比,产生交易信号,以捕捉中间镜像效应,跟踪趋势,进而获取超额收益。
策略原理
该策略使用 percentrank 指标判断价格趋势。percentrank 表示当前价格在查看周期内的相对强度。参数 len 表示查看的历史周期长度。
percentrank 的值域在 0 到 100 之间。当 percentrank 值接近 0 时表示当前价格接近查看周期内的最低价,属于价值低估区域;当接近 100 时表示当前价格接近查看周期内最高价,属于价值高估区域。
该策略还引入了 scale 参数作为偏移量。使得 0 到 100 的区间移到 scale 到 100+scale 的区间。同时设置两个信号线 level_1 和 level_2。其中 level_1 表示看多水平,level_2 表示看空水平。
当价格 percentrank 指标从下向上穿过 level_1 时产生看多信号;当从上向下穿过 level_2 时产生看空信号。平仓条件与入场信号相反。
策略优势
- 使用 percentrank 指标判断价格趋势强度,避免被困死和追高
- 应用参数优化方法,调整偏移 scale 和信号线阈值,针对不同品种和周期进行调参,提高稳定性
- 结合趋势跟踪和反转交易思想,在突破信号线后及时跟踪趋势
风险分析
- 错误判断趋势导致不必要的损失
- 价格震荡趋势不明显时,容易产生错误信号
- 参数设置不当可能导致交易频繁或交易量不足
针对以上风险,可以通过调整参数 len、scale、level 设置来优化;同时可以结合其他指标作为确认,避免错误交易。
优化方向
该策略还有进一步优化的空间:
- 可以引入止损点,降低单笔损失
- 可以结合移动均线等指标进行确认,过滤掉一些错误信号
- 可以结合机器学习方法自动优化参数
- 可以在多时间周期并行运行
总结
该策略整体思路清晰,运用参数优化的量化方法判断和跟踪价格趋势。具有一定的实战价值,但仍需进一步测试和优化,降低实战风险,提高稳定盈利能力。
策略源码
/*backtest
start: 2023-12-02 00:00:00
end: 2024-01-01 00:00:00
period: 4h
basePeriod: 15m
exchanges: [{"eid":"Futures_Binance","currency":"BTC_USDT"}]
*/

// This source code is subject to the terms of the Mozilla Public License 2.0 at https://mozilla.org/MPL/2.0/
// © Alex_Dyuk

//@version=4
strategy(title="percentrank", shorttitle="percentrank")
src = input(close, title="Source")
len = input(title="lookback - Период сравнения", type=input.integer, defval=10, minval=2)
scale = input(title="scale offset - смещение шкалы", type=input.integer, defval=50, minval=0, maxval=100)
level_1 = input(title="sygnal line 1", type=input.integer, defval=30)
level_2 = input(title="sygnal line 2", type=input.integer, defval=-30)

prank = percentrank(src,len)-scale
plot(prank, style = plot.style_columns)
plot(level_2, style = plot.style_line, color = color.red)
plot(level_1, style = plot.style_line, color = color.green)

longCondition = (crossunder(level_1, prank) == true)
if (longCondition)
    strategy.entry("Long", strategy.long)
longExitCondition = (crossover(level_2, prank) == true)
if (longExitCondition)
    strategy.close("Long")

shortCondition = (crossover(level_2, prank) == true)
if (shortCondition)
    strategy.entry("Short", strategy.short)
shortexitCondition = (crossunder(level_1, prank) == true)
if (shortexitCondition)
    strategy.close("Short")