概述
本策略名为“Bollinger Bands Volume Confirmation策略”,其核心思想是将布林带指标和交易量指标相结合,实现价格行情和交易量的双重确认,从而产生更加可靠的买入和卖出信号。
策略原理
该策略主要包含两部分:
布林带指标部分。该部分计算一定周期(如20日)的收盘价的简单移动平均线,并计算这些收盘价相对其移动平均线的标准差。然后根据标准差的数值,计算出对应移动平均线上下各一个标准差范围的带状区域,称为布林带。布林带的带状区域能清晰地显示当前价格是否处在“异常状态”。
交易量部分。该部分计算同样周期内(如20日)的交易量的移动平均值,然后利用一个乘数(如2.0)设置交易量阈值。只有当交易量超过该阈值时,才看作有效的“大量”交易量出现。
当价格上穿上轨布林带,并且交易量超过交易量阈值时,产生买入信号;当价格下穿下轨布林带,并且交易量超过交易量阈值时,产生卖出信号。
通过价格和交易量的双重确认,可以过滤掉一些假信号,使交易策略更加可靠。
策略优势
双重确认机制,避免假突破,过滤噪音。将价格和交易量指标相结合,只在两者同时确认的情况下才产生信号,可以有效避免一些因为空头情况下的价格突破造成的错误信号。
参数可调性强。用户可以自行设置布林带的周期参数及交易量阈值的倍数参数,从而适应不同市场环境。
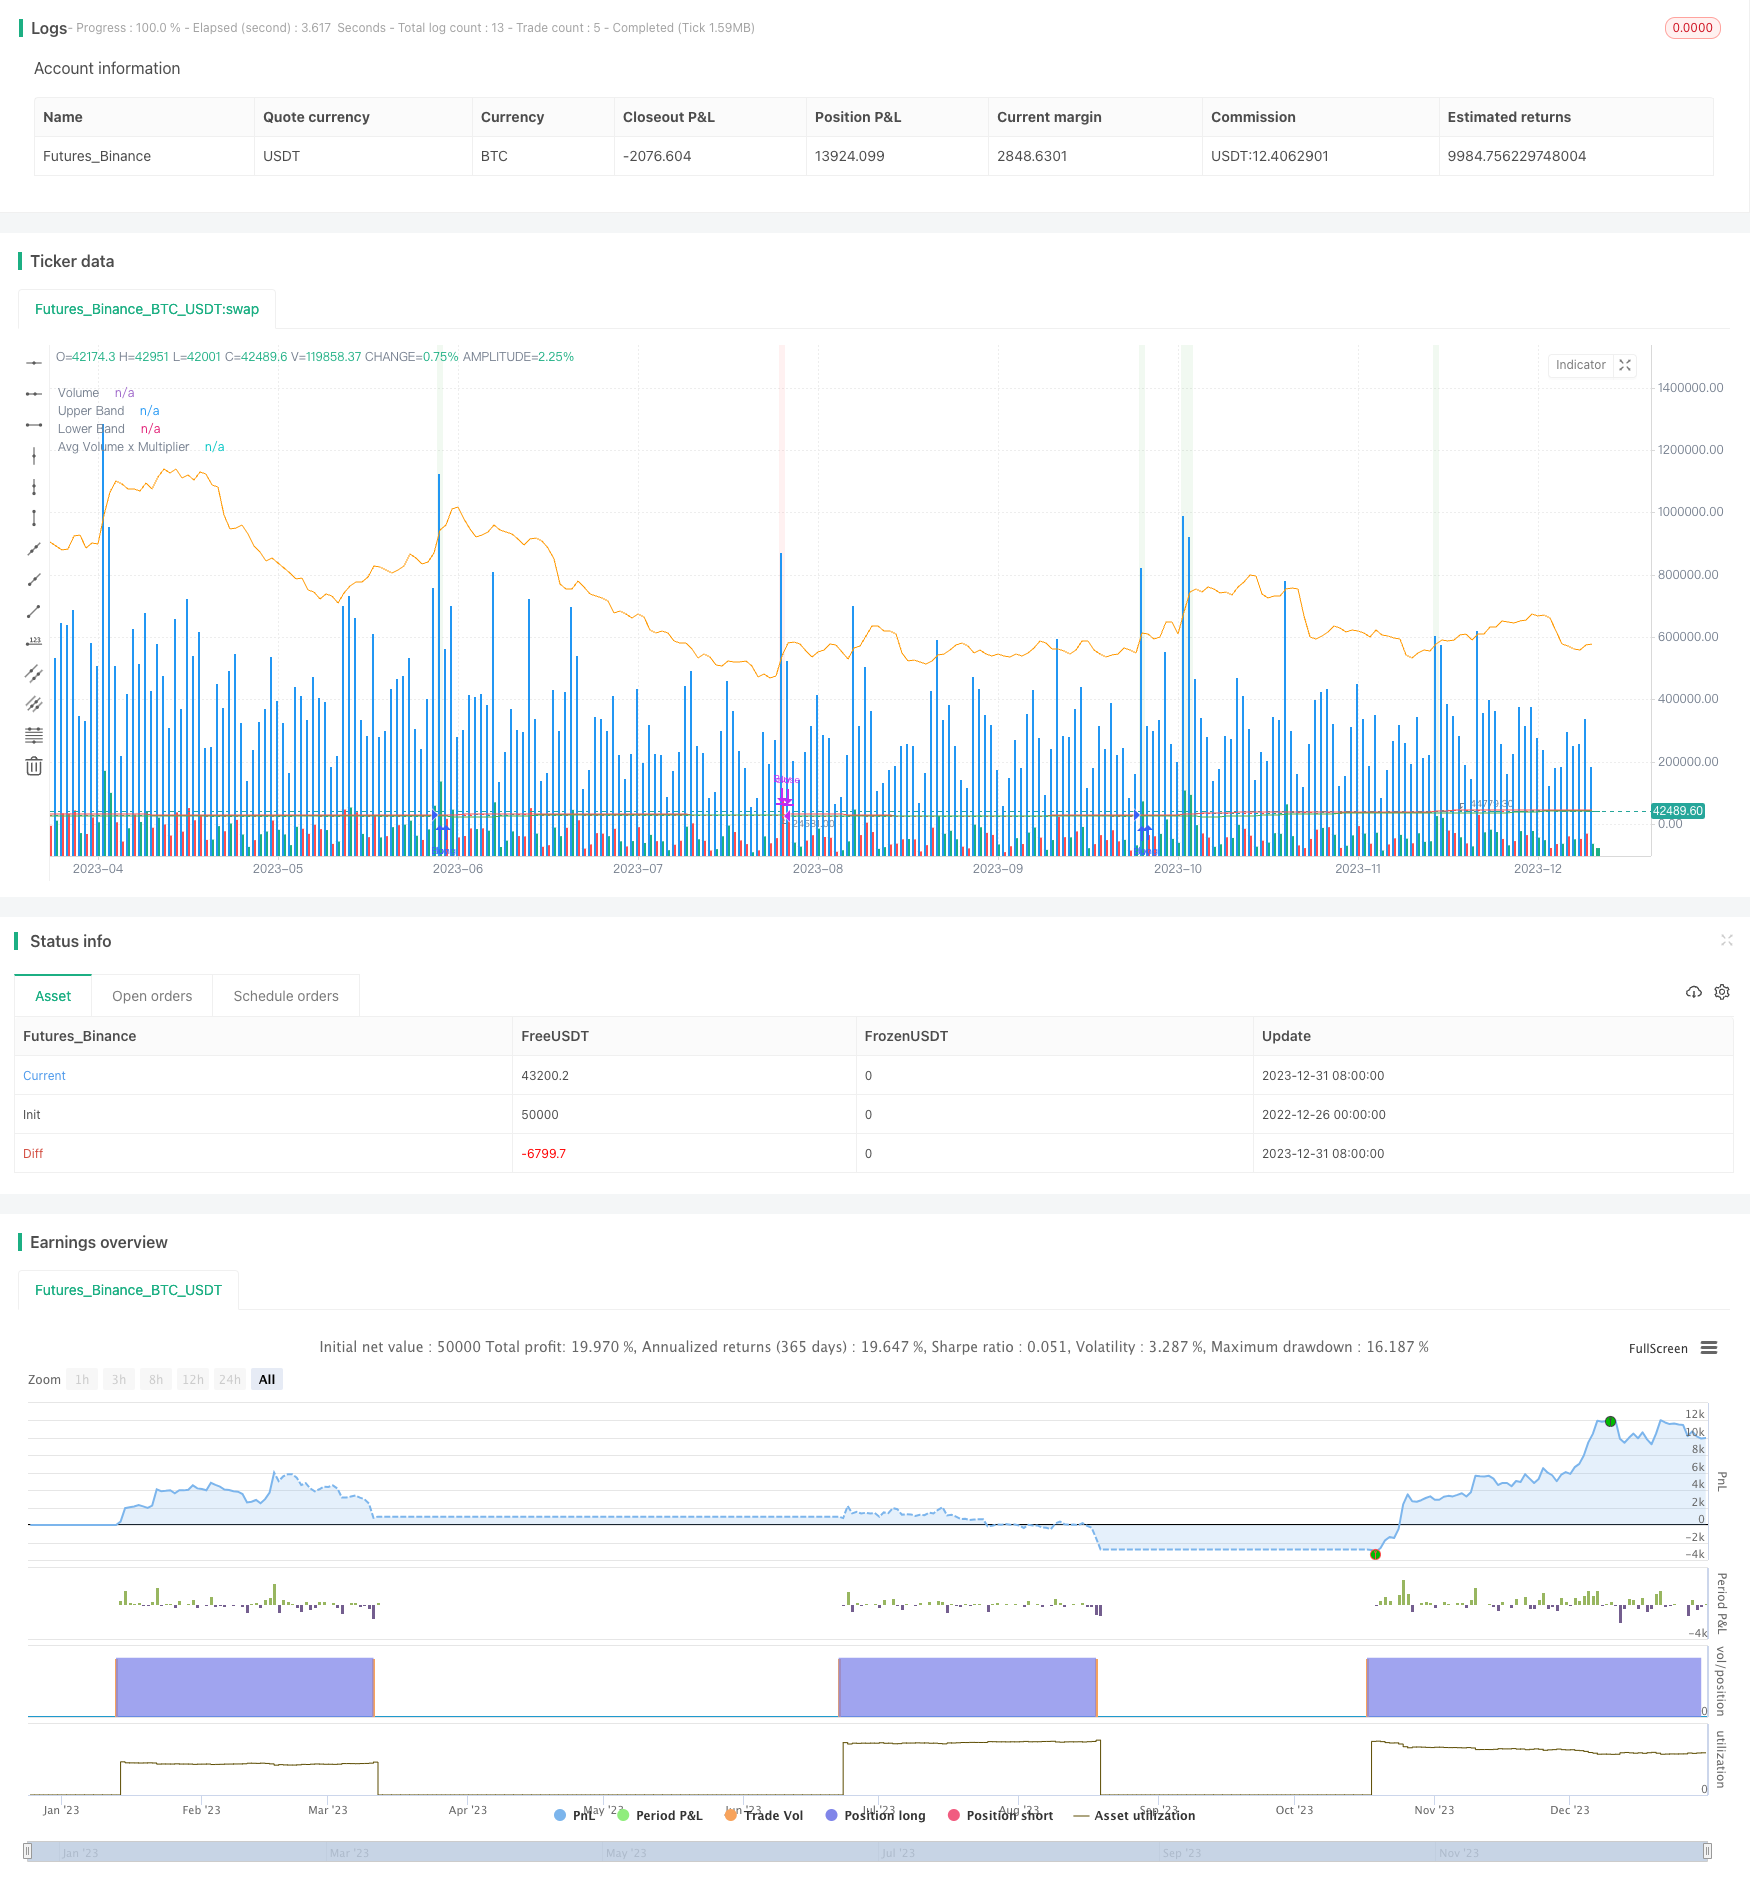
直观的示意图。上下轨布林带、交易量及交易量阈值的可视化指标,使策略信号更加直观清晰。
风险及优化分析
布林带本身并不能完美识别趋势反转点。布林带仅能清晰地显示价格的“异常状态”,但无法预测价格反转。因此仍需要结合其他指标进行判断。
交易量信号可能滞后。当快速突破上下轨布林带时,交易量的反应可能会有一定滞后,导致信号产生也滞后,无法完美捕捉转折点。
可尝试结合其他指标。如KDJ、MACD等指标,引入更多变量,建立更复杂的多元交易策略,从而提高策略的实用性。
总结
本策略通过双重确认和参数调节的方法,在一定程度上过滤了过多的噪音,使交易决策更加可靠。但仍需警惕布林带本身的局限性,后期可尝试引入其他指标进行优化,建立多元化量化策略。
/*backtest
start: 2022-12-26 00:00:00
end: 2024-01-01 00:00:00
period: 1d
basePeriod: 1h
exchanges: [{"eid":"Futures_Binance","currency":"BTC_USDT"}]
*/

//@version=5
strategy("Volume + Bollinger Bands Strategy", overlay = true, shorttitle="Vol BB Strategy")

// Bollinger Bands Parameters
length = input(20, title="BB Length")
src = close
mult = input(2.0, title="Multiplier")
basis = ta.sma(src, length)
upper = basis + mult * ta.stdev(src, length)
lower = basis - mult * ta.stdev(src, length)

// Volume Parameters
volMultiplier = input(2.0, title="Volume Multiplier")
avgVolume = ta.sma(volume, length)

// Strategy Logic
buyCondition = close > upper and volume > volMultiplier * avgVolume
sellCondition = close < lower and volume > volMultiplier * avgVolume

// Plotting
plot(upper, color=color.red, title="Upper Band")
plot(lower, color=color.green, title="Lower Band")
plot(volume, color=color.blue, style=plot.style_columns, title="Volume", transp=85)
plot(avgVolume * volMultiplier, color=color.orange, title="Avg Volume x Multiplier")

// Strategy Execution
strategy.entry("Buy", strategy.long, when=buyCondition)
strategy.close("Buy", when=sellCondition)

bgcolor(buyCondition ? color.new(color.green, 90) : sellCondition ? color.new(color.red, 90) : na)