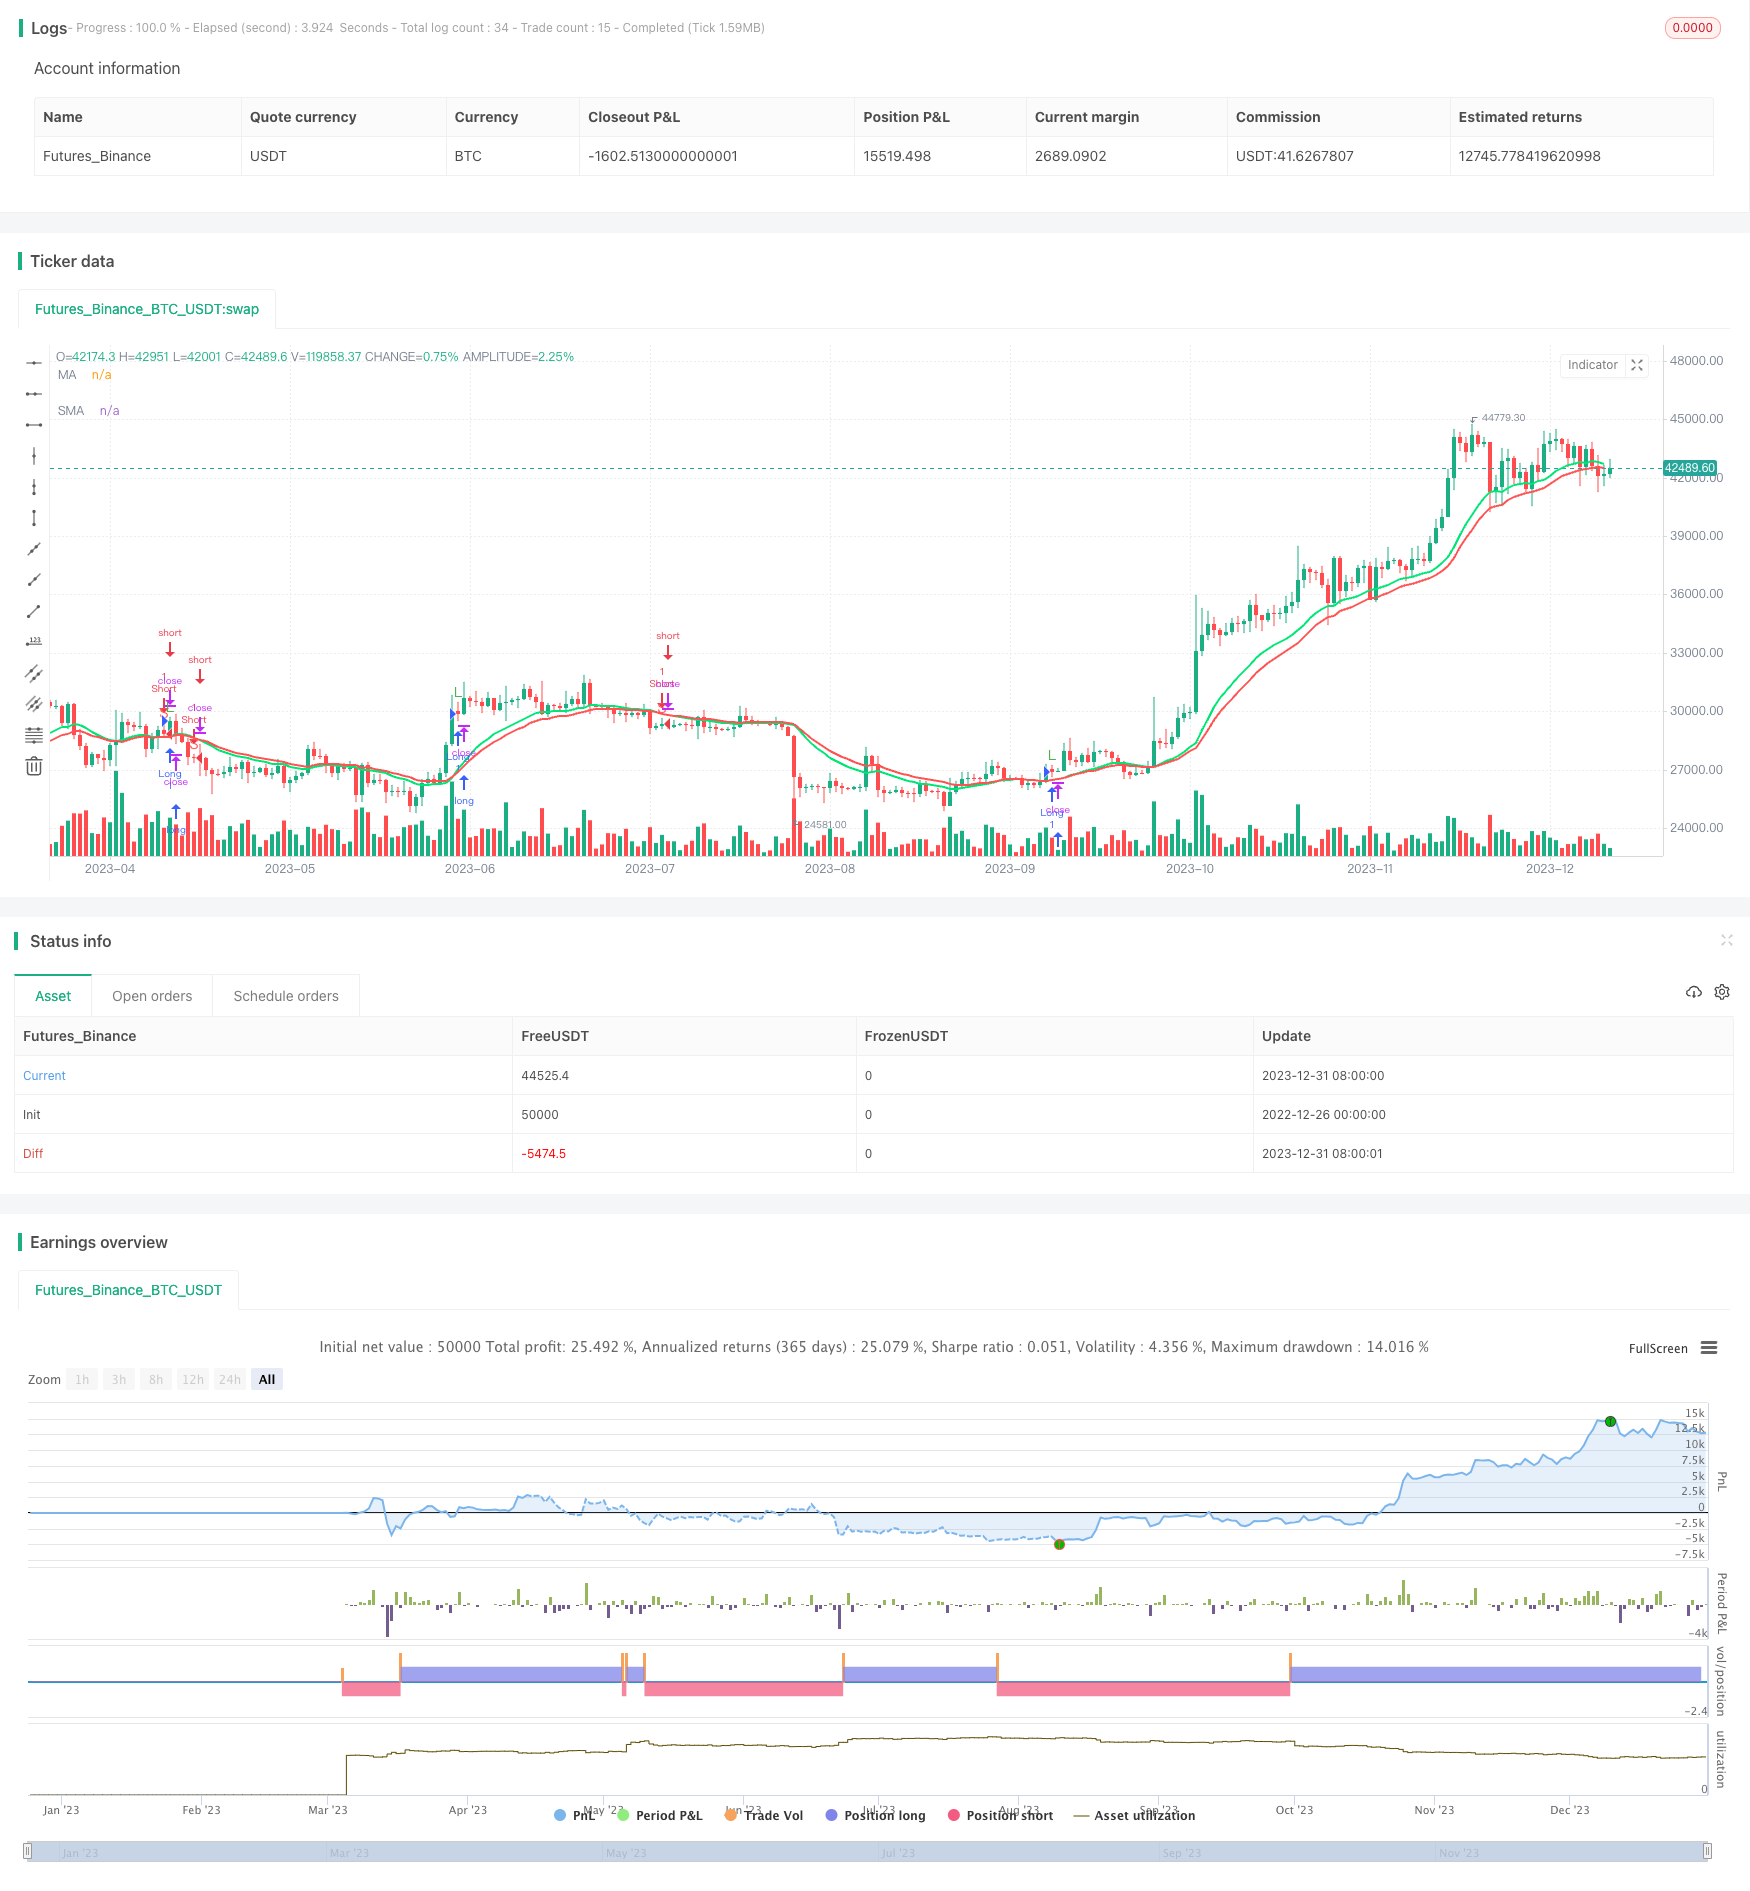
This strategy utilizes the Heikin-Ashi candlestick technique combined with moving average crossover signals and MACD indicator for filtration to construct a trend-following strategy. The strategy can capture market trends in different timeframes, generating trading signals through moving average crossovers, and then filtering out false signals via the MACD indicator, demonstrating high profitability in backtests.
The strategy mainly leverages three major technical indicators:
Heikin-Ashi Candlesticks. It modifies the closing price to construct “shadowless” candlestick bars, which can more clearly exhibit true price trends, filtering out excessive market noise.
Exponential Moving Average (EMA). The fast EMA captures short-term trends while the slow EMA judges long-term trend directions. A buy signal is generated when the fast EMA crosses above the slow EMA; A sell signal is generated when the fast EMA crosses below the slow EMA.
MACD Indicator. It combines fast and slow EMAs. When the MACD line is above the signal line, it is a bullish signal; when below, it’s a bearish signal.
The trading signals of this strategy come from the golden/dead cross of the fast and slow EMAs. To filter out false signals, the MACD indicator is introduced for auxiliary judgment. Only when the MACD gives out a signal that aligns with the EMA crossover will the final trading signal be triggered, which greatly reduces the probability of wrong trades.
Specifically, when the fast EMA crosses above the slow EMA (golden cross) and the MACD line goes above the signal line (bullish signal) simultaneously, a buy signal is generated; when the fast EMA crosses below the slow EMA (dead cross) and the MACD line goes below the signal line (bearish signal) at the same time, a sell signal is generated.
This combination of moving average crossover and MACD filtration can effectively identify key inflection points in the market and capture price trends accordingly.
The strategy has the following outstanding edges:
Greatly improved probability of capturing trend signals. The Heikin-Ashi technique offers clearer trend judgment, while the strength of crossover signals from the two EMAs is also powerful. The reliability is even higher after integrating the MACD filter.
Relatively small drawdown risk. The MACD, serving as an auxiliary indicator, can mitigate stop-loss risks to some extent and effectively reduce unwanted liquidation losses.
More tunable parameters. The periods of Heikin-Ashi candlesticks, fast/slow EMAs of the moving average system, parameters of the MACD etc. can all be adjusted based on market conditions to make the strategy more adaptive.
Simple and clear implementation. Using Heikin-Ashi candles to denote prices and aided with common indicators for determination, it is easy to program, with neat and concise codes that are intuitive to understand.
Higher capital usage efficiency. By trend-following, most of the time the strategy can align capital movements with the main market direction and generate returns more effectively.
The strategy also has the following potential risks:
Severe whipsaws in the market may lead to heavy losses. When prices gap significantly or reverse rapidly in the short-term, stop-loss measures could fail, incurring losses way beyond expectations.
Possibilities of MACD misjudgment. MACD as an auxiliary indicator can also make wrong calls, resulting in the strategy wrongly establishing or closing positions.
Inflexible parameter settings. Fixed parameter combinations may not adapt to the ever-changing market, thus missing good trading opportunities.
Potentially high trading frequency. Trend-following methods could induce frequent trades, increasing costs and slippage losses.
To mitigate and reduce the above risks, the following measures can be adopted:
Set stop-loss points to limit losses for single trades. Also, avoid over-chasing trends and control position sizes.
Adjust MACD parameters to decrease incorrect signal probabilities. More indicators can also be introduced for multi-confirmation.
Build parameter optimization mechanisms. Employ machine learning etc. to auto-tune parameter combinations for higher adaptivity.
Appropriately relax trigger conditions for trading signals to reduce trading frequency, or set minimum price change thresholds.
Great potential lies in further optimization of the strategy, including:
Optimize Heikin-Ashi candlestick durations. Test longer or shorter periods to find the ones that best exhibit market trends.
Adjust parameters of the moving average system. Modify periods of the fast/slow EMAs to discover optimal parameter sets.
Multi-parameter optimization of the MACD. Fine-tune parameters of the fast/slow EMAs and MACD signal line to locate superior configurations.
Reinforce risk management modules. Devise more scientific stop-loss/take-profit rules, integrate position sizing, capital management etc.
Introduce more auxiliary indicators. Add other indicators like KD, RSI for multi-factor confirmation, improving signal quality.
Employ machine learning techniques. Leverage neural networks, genetic algorithms etc. to real-time optimize strategy parameters for higher adaptivity.
With iterative combinations of technical indicators, continuous parameter optimizations, stronger risk control modules etc., significant performance boosts of the strategy can be expected for more steady and efficient profitability.
This strategy captures market trends by combining Heikin-Ashi candles and moving average crossovers, aided by MACD filtration for detecting high-reliability turning points and trading signals. Backtested results are outstanding, with edges like high winning probability, low drawdowns, high tunability. Meanwhile, risk control also needs attention to hedge impacts from extreme market moves. With continuous improvements and optimization, the strategy demonstrates great potential as a highly effective quantitative trading strategy.
/*backtest start: 2022-12-26 00:00:00 end: 2024-01-01 00:00:00 period: 1d basePeriod: 1h exchanges: [{"eid":"Futures_Binance","currency":"BTC_USDT"}] */ //@version=2 //Heikin Ashi Strategy V1 by nachobuey strategy("Heikin Ashi Strategy V2",shorttitle="HAS V2",overlay=true) res = input(title="Heikin Ashi Candle Time Frame", defval="15") hshift = input(0,title="Heikin Ashi Candle Time Frame Shift") //res1 = input(title="Heikin Ashi EMA Time Frame", type=resolution, defval="180") res1 = input(title="Time frame (Minutes. Not lower than chart)",defval="300") mhshift = input(0,title="Heikin Ashi EMA Time Frame Shift") fama = input(16,"Heikin Ashi EMA Period") test = input(0,"Heikin Ashi EMA Shift") sloma = input(21,"Slow EMA Period") slomas = input(0,"Slow EMA Shift") macdf = input(false,title="With MACD filter") res2 = input(title="MACD Time Frame", defval="60") macds = input(1,title="MACD Shift") //Heikin Ashi Open/Close Price ha_t = heikinashi(syminfo.tickerid) ha_open = request.security(ha_t, res, open[hshift]) ha_close = request.security(ha_t, res, close[hshift]) mha_close = request.security(ha_t, res1, close[mhshift]) //macd [macdLine, signalLine, histLine] = macd(close, 12, 26, 9) macdl = request.security(ha_t,res2,macdLine[macds]) macdsl= request.security(ha_t,res2,signalLine[macds]) //Moving Average fma = ema(mha_close[test],fama) sma = ema(ha_close[slomas],sloma) plot(fma,title="MA",color=lime,linewidth=2,style=line) plot(sma,title="SMA",color=red,linewidth=2,style=line) //Strategy golong = crossover(fma,sma) and (macdl > macdsl or macdf == false ) goshort = crossunder(fma,sma) and (macdl < macdsl or macdf == false ) strategy.entry("Long",strategy.long,when = golong) strategy.entry("Short",strategy.short,when = goshort) plotchar(golong,char="L", color=green) plotchar(goshort,char="S", color=red) alertcondition(golong, "HAS GO LONG", "OPEN LONG") alertcondition(goshort, "HAS GO SHORT", "OPEN SHORT")template: strategy.tpl:40:21: executing "strategy.tpl" at <.api.GetStrategyListByName>: wrong number of args for GetStrategyListByName: want 7 got 6