概述
日K线突破策略是一个基于日线K线的简单趋势跟踪策略。它通过观察前一日K线的收盘价与开盘价的关系来判断市场走势,从而产生交易信号。
策略原理
该策略的核心逻辑是:
如果前一日K线实体为绿色(收盘价高于开盘价),则说明前一日为上涨趋势,该策略会在次日开盘时做多;如果前一日K线实体为红色(收盘价低于开盘价),则说明前一日为下跌趋势,该策略会在次日开盘时做空。
通过这种简单的方式,策略能够判断最近一个K线周期内的市场走势,并据此进行交易。这样能够顺应最近的市场趋势,实现趋势跟踪交易。
具体来说,策略的交易信号产生如下:
- 在每一交易日开盘时,获取前一日的K线数据
- 比较前一日K线的开盘价和收盘价
- 如果开盘价低于收盘价(绿色K线),产生做多信号,按照可用资金的比例做多
- 如果开盘价高于收盘价(红色K线),产生做空信号,按照可用资金的比例做空
- 使用止损退出做多做空头寸
通过这样的逻辑,策略能够抓住较短周期内的价格趋势,以获利。
策略优势
该策略主要具有以下几个优势:
- 简单明了。核心逻辑直接比较K线实体颜色,非常简洁,容易理解和实现。
- 顺应趋势。能够判断最近一个交易日的趋势方向,顺应较短周期的价格走势。
- 灵活调整。可以通过调整仓位比例、止损幅度等参数,调整策略的收益风险特征。
- 容易优化。如加入多个周期判断、数据拟合等,可以继续优化,提高策略稳定性。
风险与改进
该策略也存在一些风险与可优化的地方:
- 抓反弹风险。策略仅看单日K线实体,可能在震荡行情中抓到反弹而不是趋势。这可以通过加入更多K线或指标作为盘整判断来优化。
- 空头风险。做空交易有无底风险,需要严格止损控制亏损。
- 参数优化。止损幅度、仓位大小等参数可继续优化,以平衡收益风险。
- 技术指标结合。可加入更多技术指标判断,提高策略稳定性。
总结
日K线突破策略通过简单有效的日线比较方式判断市场走势,能够抓住短周期趋势进行交易。策略优势在于简单明确,容易操作,但也存在被反弹截获的风险。通过进一步优化参数设定及加入更多技术指标,可以提高策略稳定性与可靠性。
策略源码
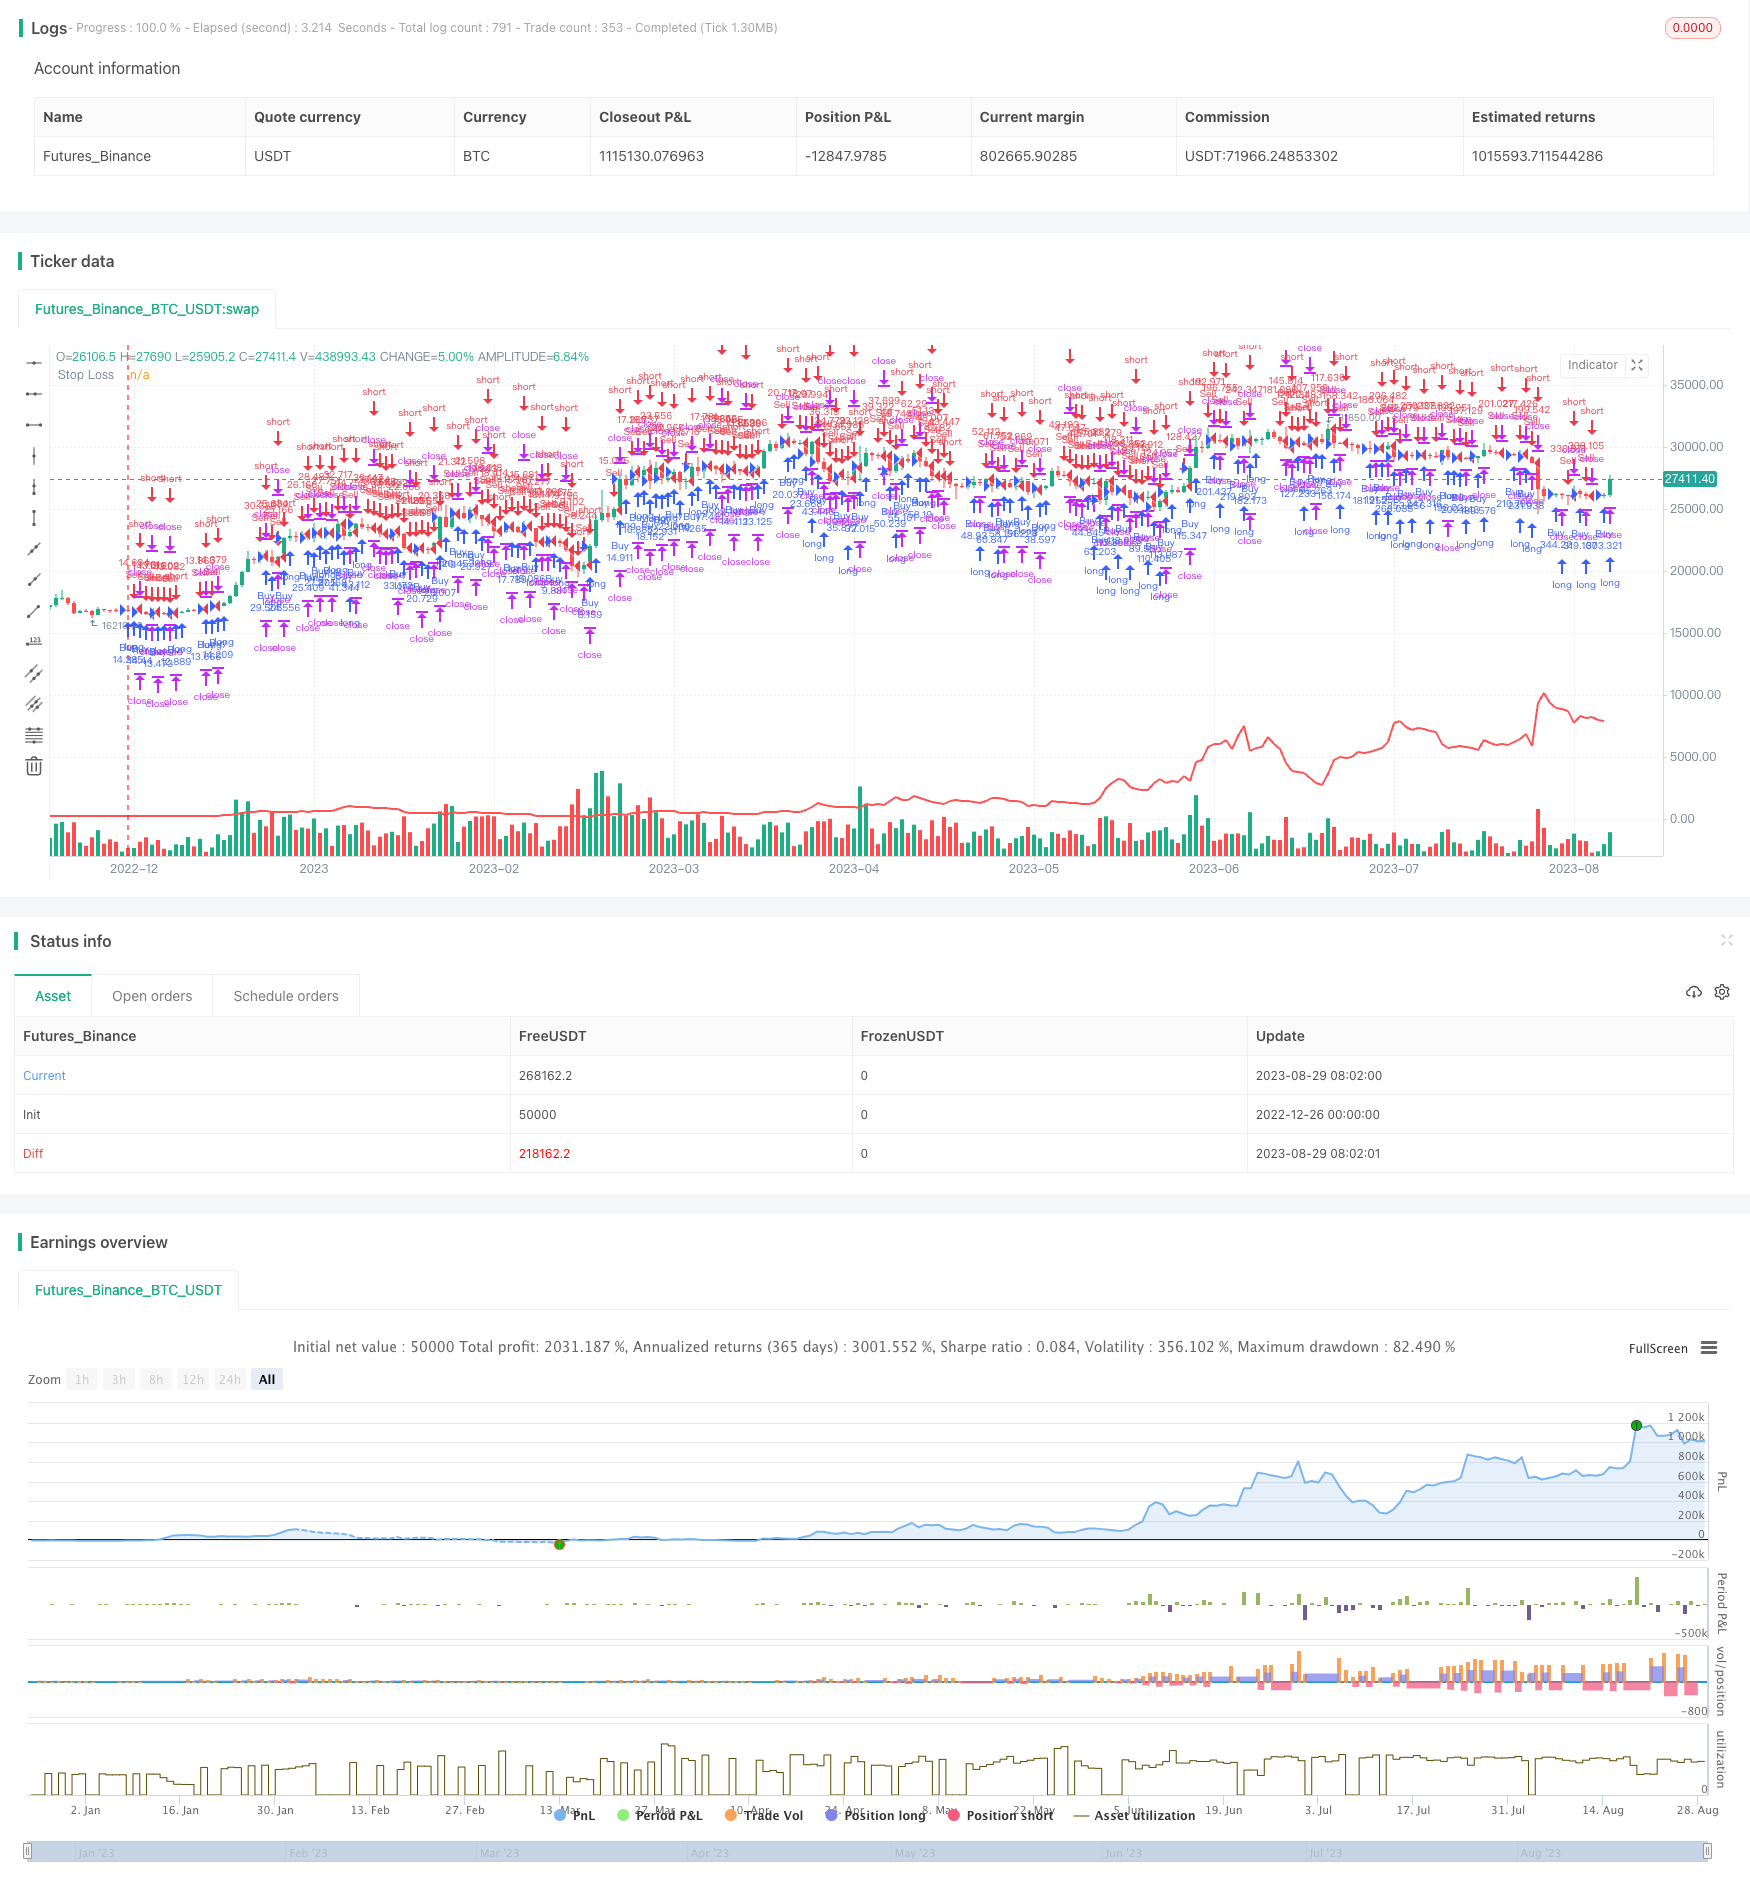
/*backtest
start: 2022-12-26 00:00:00
end: 2023-08-30 00:00:00
period: 1d
basePeriod: 1h
exchanges: [{"eid":"Futures_Binance","currency":"BTC_USDT"}]
*/

//@version=5
strategy("Daily Candle Strategy", overlay=true, default_qty_type=strategy.percent_of_equity, default_qty_value=0.0)

// Input parameters
initialCapital = 10000
riskFactor = 3500

// Calculate the opening and closing values for the last day's candle
lastDayOpen = request.security(syminfo.tickerid, "D", open[1], lookahead=barmerge.lookahead_on)
lastDayClose = request.security(syminfo.tickerid, "D", close[1], lookahead=barmerge.lookahead_on)

// Determine the color of the last day's candle
lastDayColor = lastDayOpen < lastDayClose ? color.green : color.red

// Plot the last day's candle on the chart
plotshape(series=na, color=lastDayColor, style=shape.triangledown, location=location.abovebar)

// Calculate trade size based on available capital at last day's closing
availableCapital = strategy.equity
tradeSize = availableCapital / riskFactor

// Trading conditions
buyCondition = lastDayColor == color.green
sellCondition = lastDayColor == color.red

// Execute strategy orders with calculated trade size
strategy.entry("Buy", strategy.long, qty=tradeSize, when=buyCondition)
strategy.entry("Sell", strategy.short, qty=tradeSize, when=sellCondition)

// Exit strategy
stopLoss = 0.001 * lastDayOpen * tradeSize
strategy.exit("StopLoss/Profit", from_entry="Buy", loss=stopLoss)
strategy.exit("StopLoss/Profit", from_entry="Sell", loss=stopLoss)

// Plot stop loss level on the chart
plot(stopLoss, color=color.red, linewidth=2, title="Stop Loss")