概述
刚性突破策略是一种基于价格刚性指标的突破策略。它通过计算一定周期内收盘价突破上轨的次数,来判断价格的刚性。当刚性指标超过设定阈值时,判断行情即将突破,进行买入操作;当刚性指标低于阈值时,判断行情即将回落,进行卖出操作。
策略原理
计算均线和标准差:首先计算n周期的简单移动平均线作为基准上轨,然后计算价格标准差的0.2倍作为下轨的缓冲。
计算刚性指标:统计m周期内收盘价高于上轨的天数,除以m得到0-100的值,再用n周期EMA平滑,得到最终的刚性值,表示价格突破上轨的概率。
比较刚性与阈值:当刚性指标上穿设定阈值时,表明突破概率增加,产生买入信号;当刚性指标下穿阈值时,表明突破概率下降,产生卖出信号。
进场和出场:收盘价突破上轨时买入,突破失败开始下跌时卖出。做多突破的同时,也可做空回调。
优势分析
捕捉突破的时机: relativel比较可靠地判断趋势是否即将出现突破或回调的时机,从而提前进入场内。
兼顾突破与回调: 该策略同时利用刚性指标的突破与回落,实现做多和做空机会的捕捉。
参数灵活: 用户可以根据市场调整均线长度、刚性周期、阈值等参数,适应不同周期和市场的特征。
实现简单: 仅利用刚性指标和阈值比较,没有复杂逻辑,代码实现较为简洁。
风险分析
突破失败风险: 刚性超过阈值时,并不能完全保证价格会突破上轨,存在一定的假突破风险。
回调范围风险: 做空时无法预测具体的回调范围和位置,存在亏损过多的风险。
参数优化风险: 参考参数无法完全适应市场的变化,需要根据实际情况不断测试和优化。
频繁交易风险: 该策略交易频率较高,会增加交易成本和滑点的损耗。
优化方向
优化参数: 可以测试不同市场下的参数设置,寻找最佳参数组合。比如增加均线长度来降低交易频率等。
加入止损: 设置合理的止损逻辑,来控制单笔亏损。可以根据atr 来设置止损位。
结合其他指标: 可以加入类似MACD,KD等指标来决定具体的入场点位,减少假突破的概率。
优化出场条件: 可以基于趋势指标等确定趋势反转的特征,设置更加准确的出场条件。
总结
刚性突破策略整体来说较为简单实用。它可以提前判断价格可能的突破和回落时机,具有一定的实用价值。但我们也需要注意假突破和回调范围的问题,通过参数优化和加入其他technical指标来锁定更精准的交易机会。
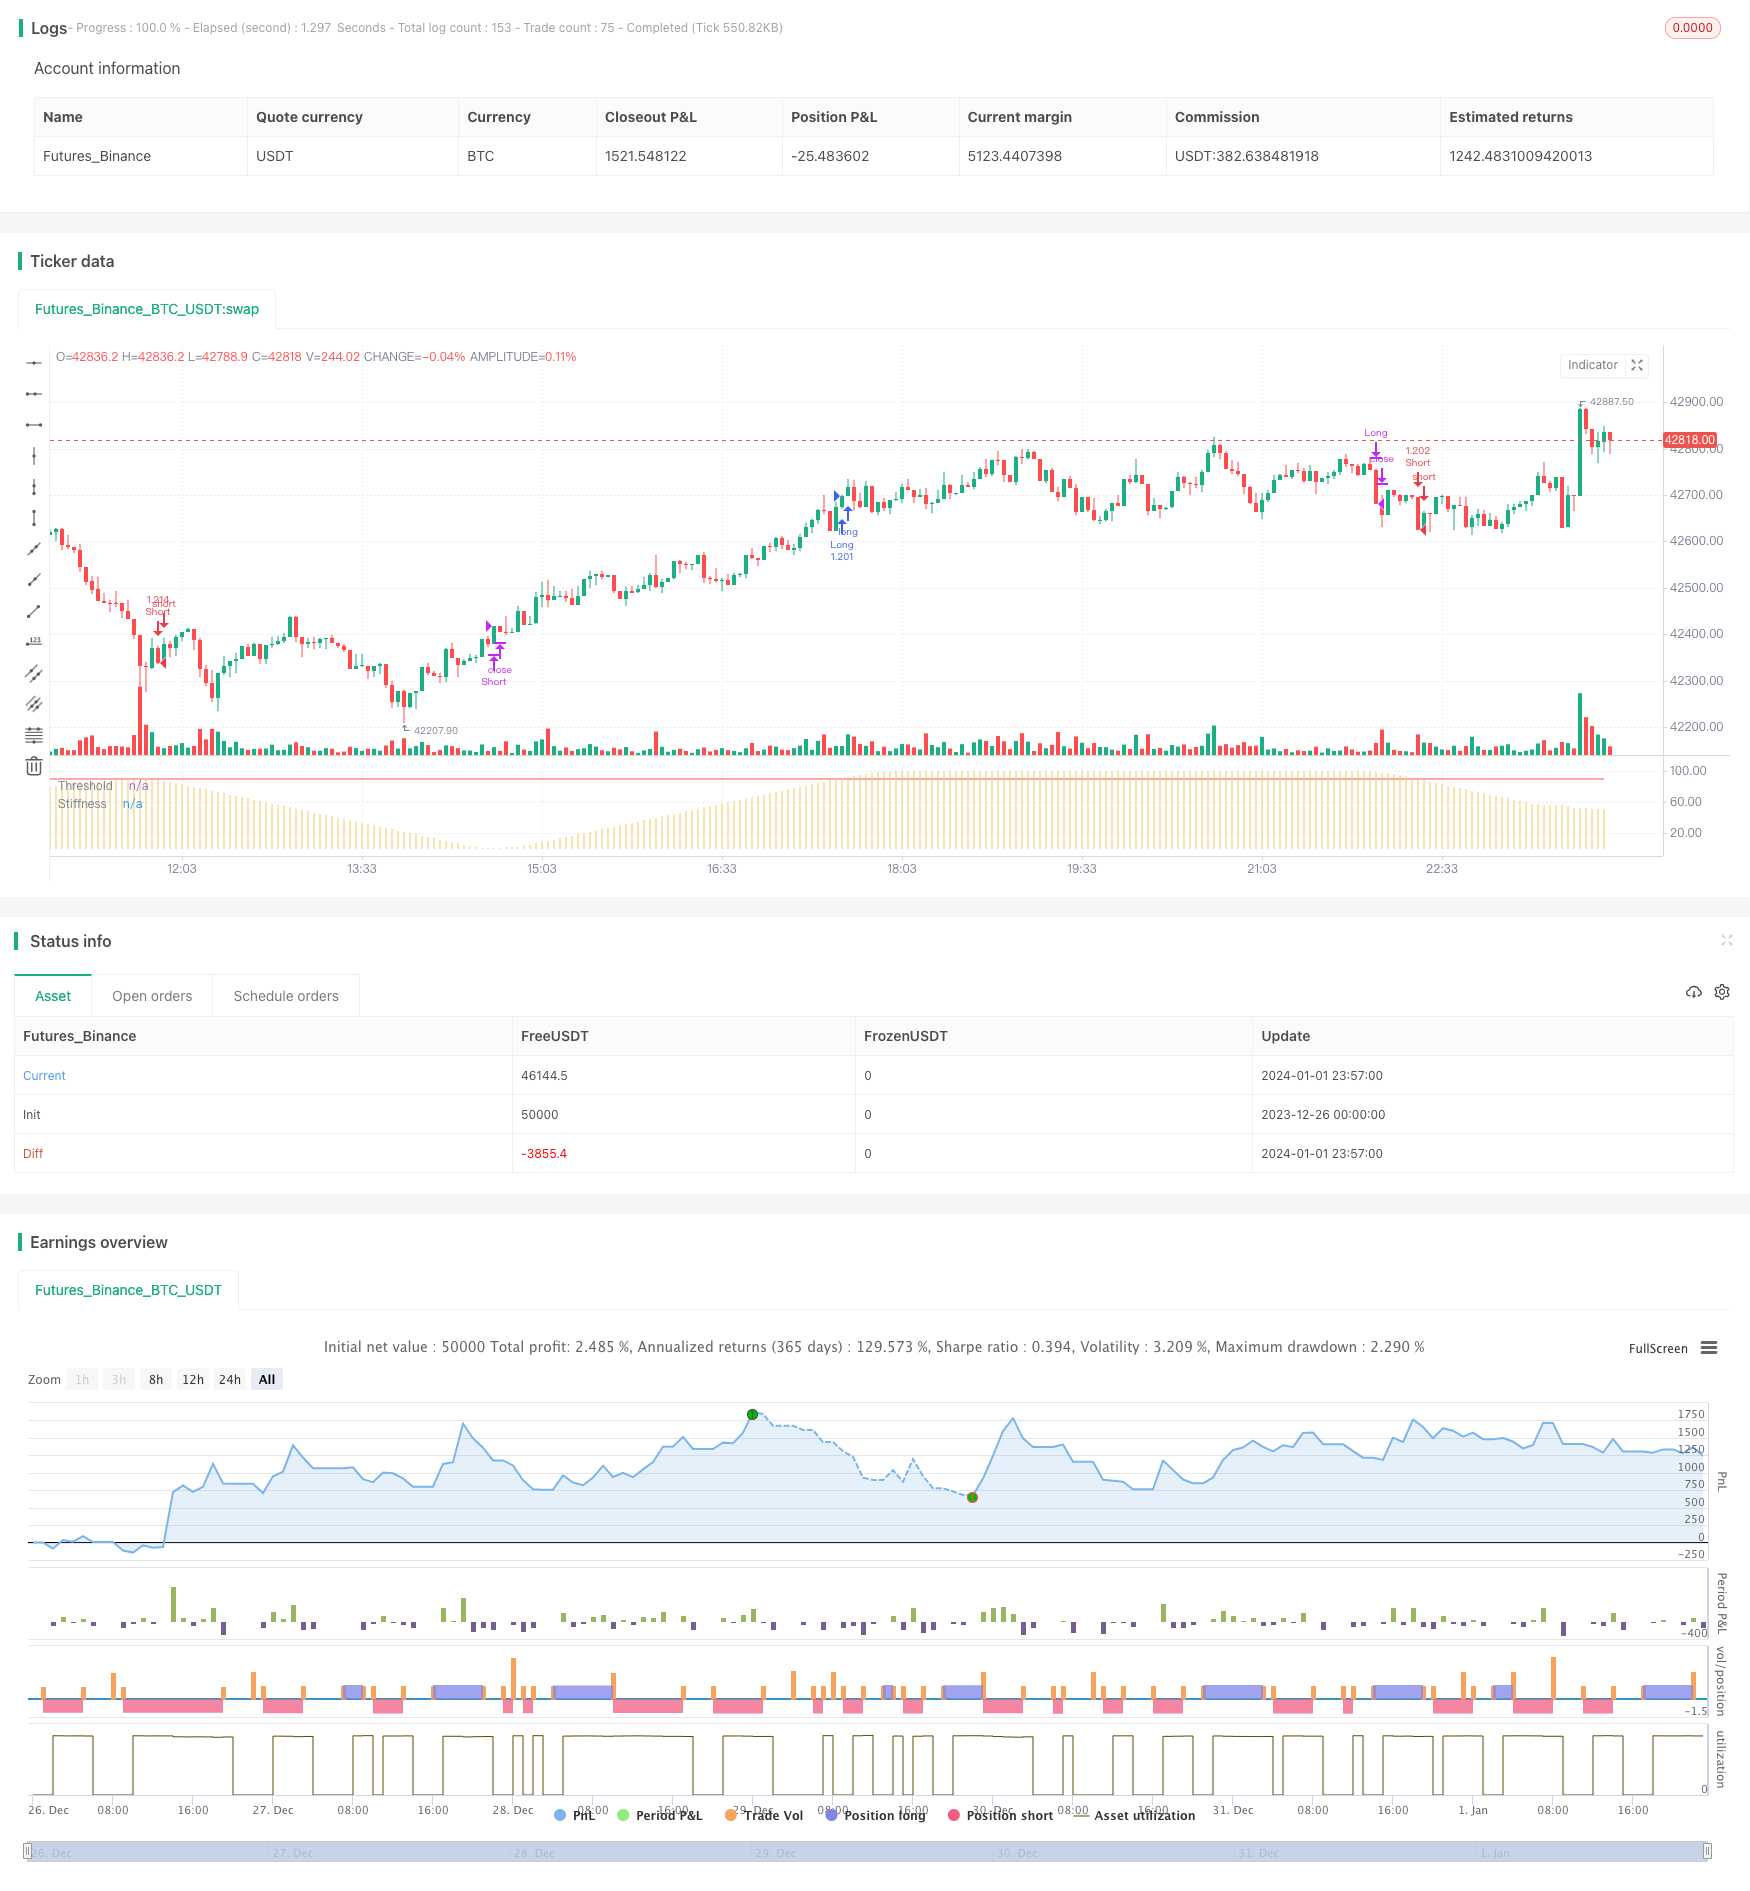
/*backtest
start: 2023-12-26 00:00:00
end: 2024-01-02 00:00:00
period: 3m
basePeriod: 1m
exchanges: [{"eid":"Futures_Binance","currency":"BTC_USDT"}]
*/

//@version=4
// Copyright (c) 2020-present, JMOZ (1337.ltd)
// Copyright (c) 2018-present, Alex Orekhov (everget)
// Stiffness Indicator script may be freely distributed under the MIT license.
strategy("Stiffness Strategy", overlay=false, initial_capital=10000, default_qty_type=strategy.percent_of_equity, default_qty_value=100, commission_value=0.075)


maLength = input(title="Moving Average Length", minval=1, defval=100)
stiffLength = input(title="Stiffness Length", minval=1, defval=60)
stiffSmooth = input(title="Stiffness Smoothing Length", minval=1, defval=3)
threshold = input(title="Threshold", minval=1, defval=90)
highlightThresholdCrossovers = input(title="Highlight Threshold Crossovers ?", type=input.bool, defval=false)


bound = sma(close, maLength) - 0.2 * stdev(close, maLength)
sumAbove = sum(close > bound ? 1 : 0, stiffLength)
stiffness = ema(sumAbove * 100 / stiffLength, stiffSmooth)


long_cond = crossover(stiffness, threshold)
long_close = stiffness > threshold and falling(stiffness, 1)
short_cond = crossunder(stiffness, threshold) or stiffness < threshold and falling(stiffness, 1)
short_close = stiffness < threshold and rising(stiffness, 1)


strategy.entry("Long", strategy.long, when=long_cond)
strategy.close("Long", when=long_close)
strategy.entry("Short", strategy.short, when=short_cond)
strategy.close("Short", when=short_close)


transparent = color.new(color.white, 100)

bgColor = highlightThresholdCrossovers ? stiffness > threshold ? #0ebb23 : color.red : transparent
bgcolor(bgColor, transp=90)

plot(stiffness, title="Stiffness", style=plot.style_histogram, color=#f5c75e, transp=0)
plot(threshold, title="Threshold", color=color.red, transp=0)