概述
该交易策略是基于MACD指标的200日移动均线进行信号交叉操作的量化策略。它结合了MACD指标判断市场买卖信号和200日移动均线判断市场趋势的双重功能,旨在发掘更精准的入市和出市时机。
策略原理
该策略的核心要点有两点:
MACD指标的快慢线交叉产生买入和卖出信号。当快线从下方向上突破慢线时,产生买入信号;当快线从上方向下跌破慢线时,产生卖出信号。
200日移动均线判断市场总体走势。价格在200日均线之上为多头市场,之下为空头市场。只有在多头市场产生买入信号时才买入,在空头市场产生卖出信号时才卖出。
根据这两个要点,该策略的具体交易规则是:
当MACD快线从下方向上突破MACD慢线、柱状图为负值且价格高于200日移动均线时,进行买入操作;当MACD快线从上方向下跌破MACD慢线、柱状图为正值且价格低于200日移动均线时,进行卖出操作。
策略优势
双重判断提高策略的稳定性和成功率。MACD判断买卖信号,200日均线判断市场趋势,双重判断可以过滤掉一些不确定性较大的交易信号。
在趋势较强的市场中,该策略可以带来较高的盈利。特别是在牛市中,它可以快速捕捉价格上涨的机会。
MACD指标对于摆脱震荡盘整理阶段也较为敏感,当价格结束了长时间的震荡整理进入趋势行情后,该策略可以快速捕捉新的趋势方向。
风险分析
该策略对参数设置较为敏感。如果MACD指标参数设置不当,可能会产生误入误出的情况。
在趋势转折点附近,MACD指标的买卖信号会产生较多错误。这时该策略的盈利可能会出现一次较大的回撤。
当价格长期处于横盘整理状态时,该策略无法确定明确的趋势方向,这会导致盈亏波动加大,回撤时间延长。
策略优化方向
可以测试不同的参数组合,找到产生信号更准确的MACD参数。
可以考虑加入其他技术指标进行确认,例如RSI、KD等,形成多种指标共振,以提高策略的可靠性。
可以设置止损点来控制最大回撤。当价格出现较大幅度的逆向突破时立刻止损出场,可有效避免止损扩大。
总结
MACD200日均线交叉策略结合了趋势判断和交易信号判断双重功能,可以有效提高盈利概率,是一种较为稳健可靠的量化交易策略。但该策略对参数和市场状态也有一定的依赖性,通过继续优化测试可以进一步提高策略的稳定盈利能力。[/
/*backtest
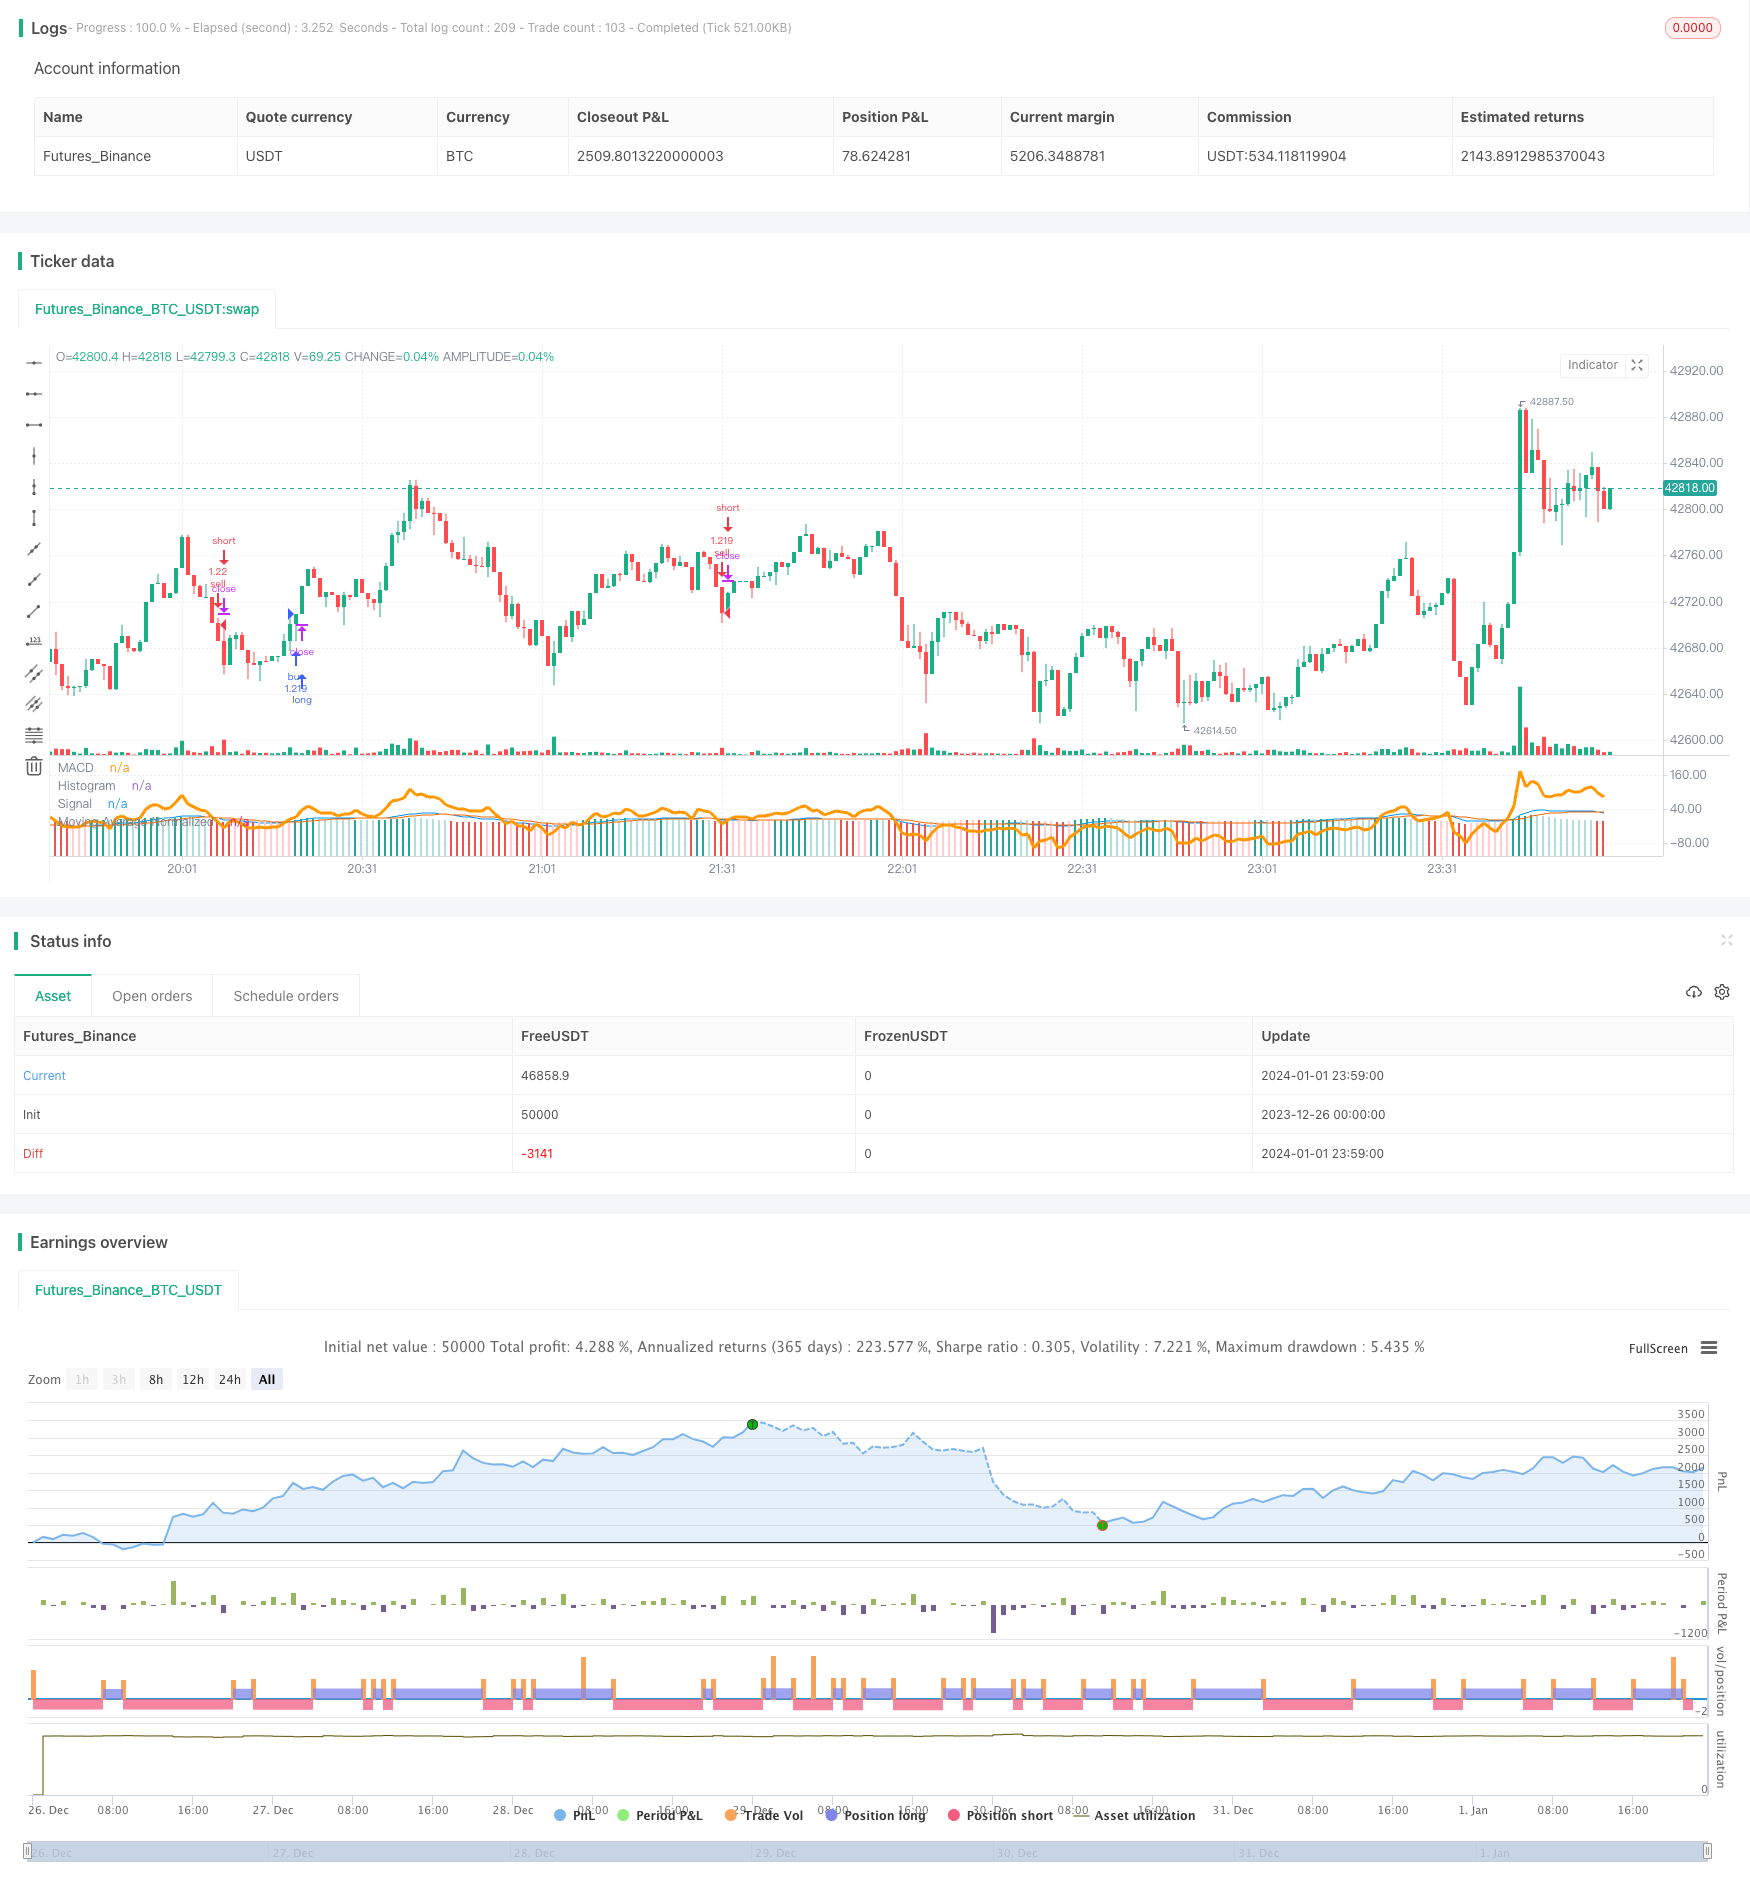
start: 2023-12-26 00:00:00
end: 2024-01-02 00:00:00
period: 1m
basePeriod: 1m
exchanges: [{"eid":"Futures_Binance","currency":"BTC_USDT"}]
*/
// This source code is subject to the terms of the Mozilla Public License 2.0 at https://mozilla.org/MPL/2.0/
// © x11joe
//@version=4
//This strategy is based on a youtube strategy that suggested I do this...so I did!
strategy(title="MacD 200 Day Moving Average Signal Crossover Strategy", overlay=false, precision=2,commission_value=0.26, initial_capital=10000, currency=currency.USD, default_qty_type=strategy.percent_of_equity, default_qty_value=100)
// Getting inputs
fast_length = input(title="Fast Length", type=input.integer, defval=12)
slow_length = input(title="Slow Length", type=input.integer, defval=26)
src = input(title="Source", type=input.source, defval=close)
signal_length = input(title="Signal Smoothing", type=input.integer, minval = 1, maxval = 50, defval = 9)
sma_source = input(title="Simple MA(Oscillator)", type=input.bool, defval=false)
sma_signal = input(title="Simple MA(Signal Line)", type=input.bool, defval=false)
// Plot colors
col_grow_above = #26A69A
col_grow_below = #FFCDD2
col_fall_above = #B2DFDB
col_fall_below = #EF5350
col_macd = #0094ff
col_signal = #ff6a00
// Calculating
fast_ma = sma_source ? sma(src, fast_length) : ema(src, fast_length)
slow_ma = sma_source ? sma(src, slow_length) : ema(src, slow_length)
macd = fast_ma - slow_ma
signal = sma_signal ? sma(macd, signal_length) : ema(macd, signal_length)
hist = macd - signal
moving_avg_length = input(title="Moving Average Length", type=input.integer, defval=200)
moving_avg = sma(close,moving_avg_length)
moving_avg_normalized = close - moving_avg
plot(moving_avg_normalized, title="Moving Average Normalized", style=plot.style_line, color=color.orange,linewidth=3)
plot(hist, title="Histogram", style=plot.style_columns, color=(hist>=0 ? (hist[1] < hist ? col_grow_above : col_fall_above) : (hist[1] < hist ? col_grow_below : col_fall_below) ), transp=0 )
plot(macd, title="MACD", color=col_macd, transp=0)
plot(signal, title="Signal", color=col_signal, transp=0)
if(macd>signal and macd<0 and close>moving_avg)
strategy.entry("buy",strategy.long)
if(close<moving_avg and macd<signal and macd>0)
strategy.entry("sell",strategy.short)