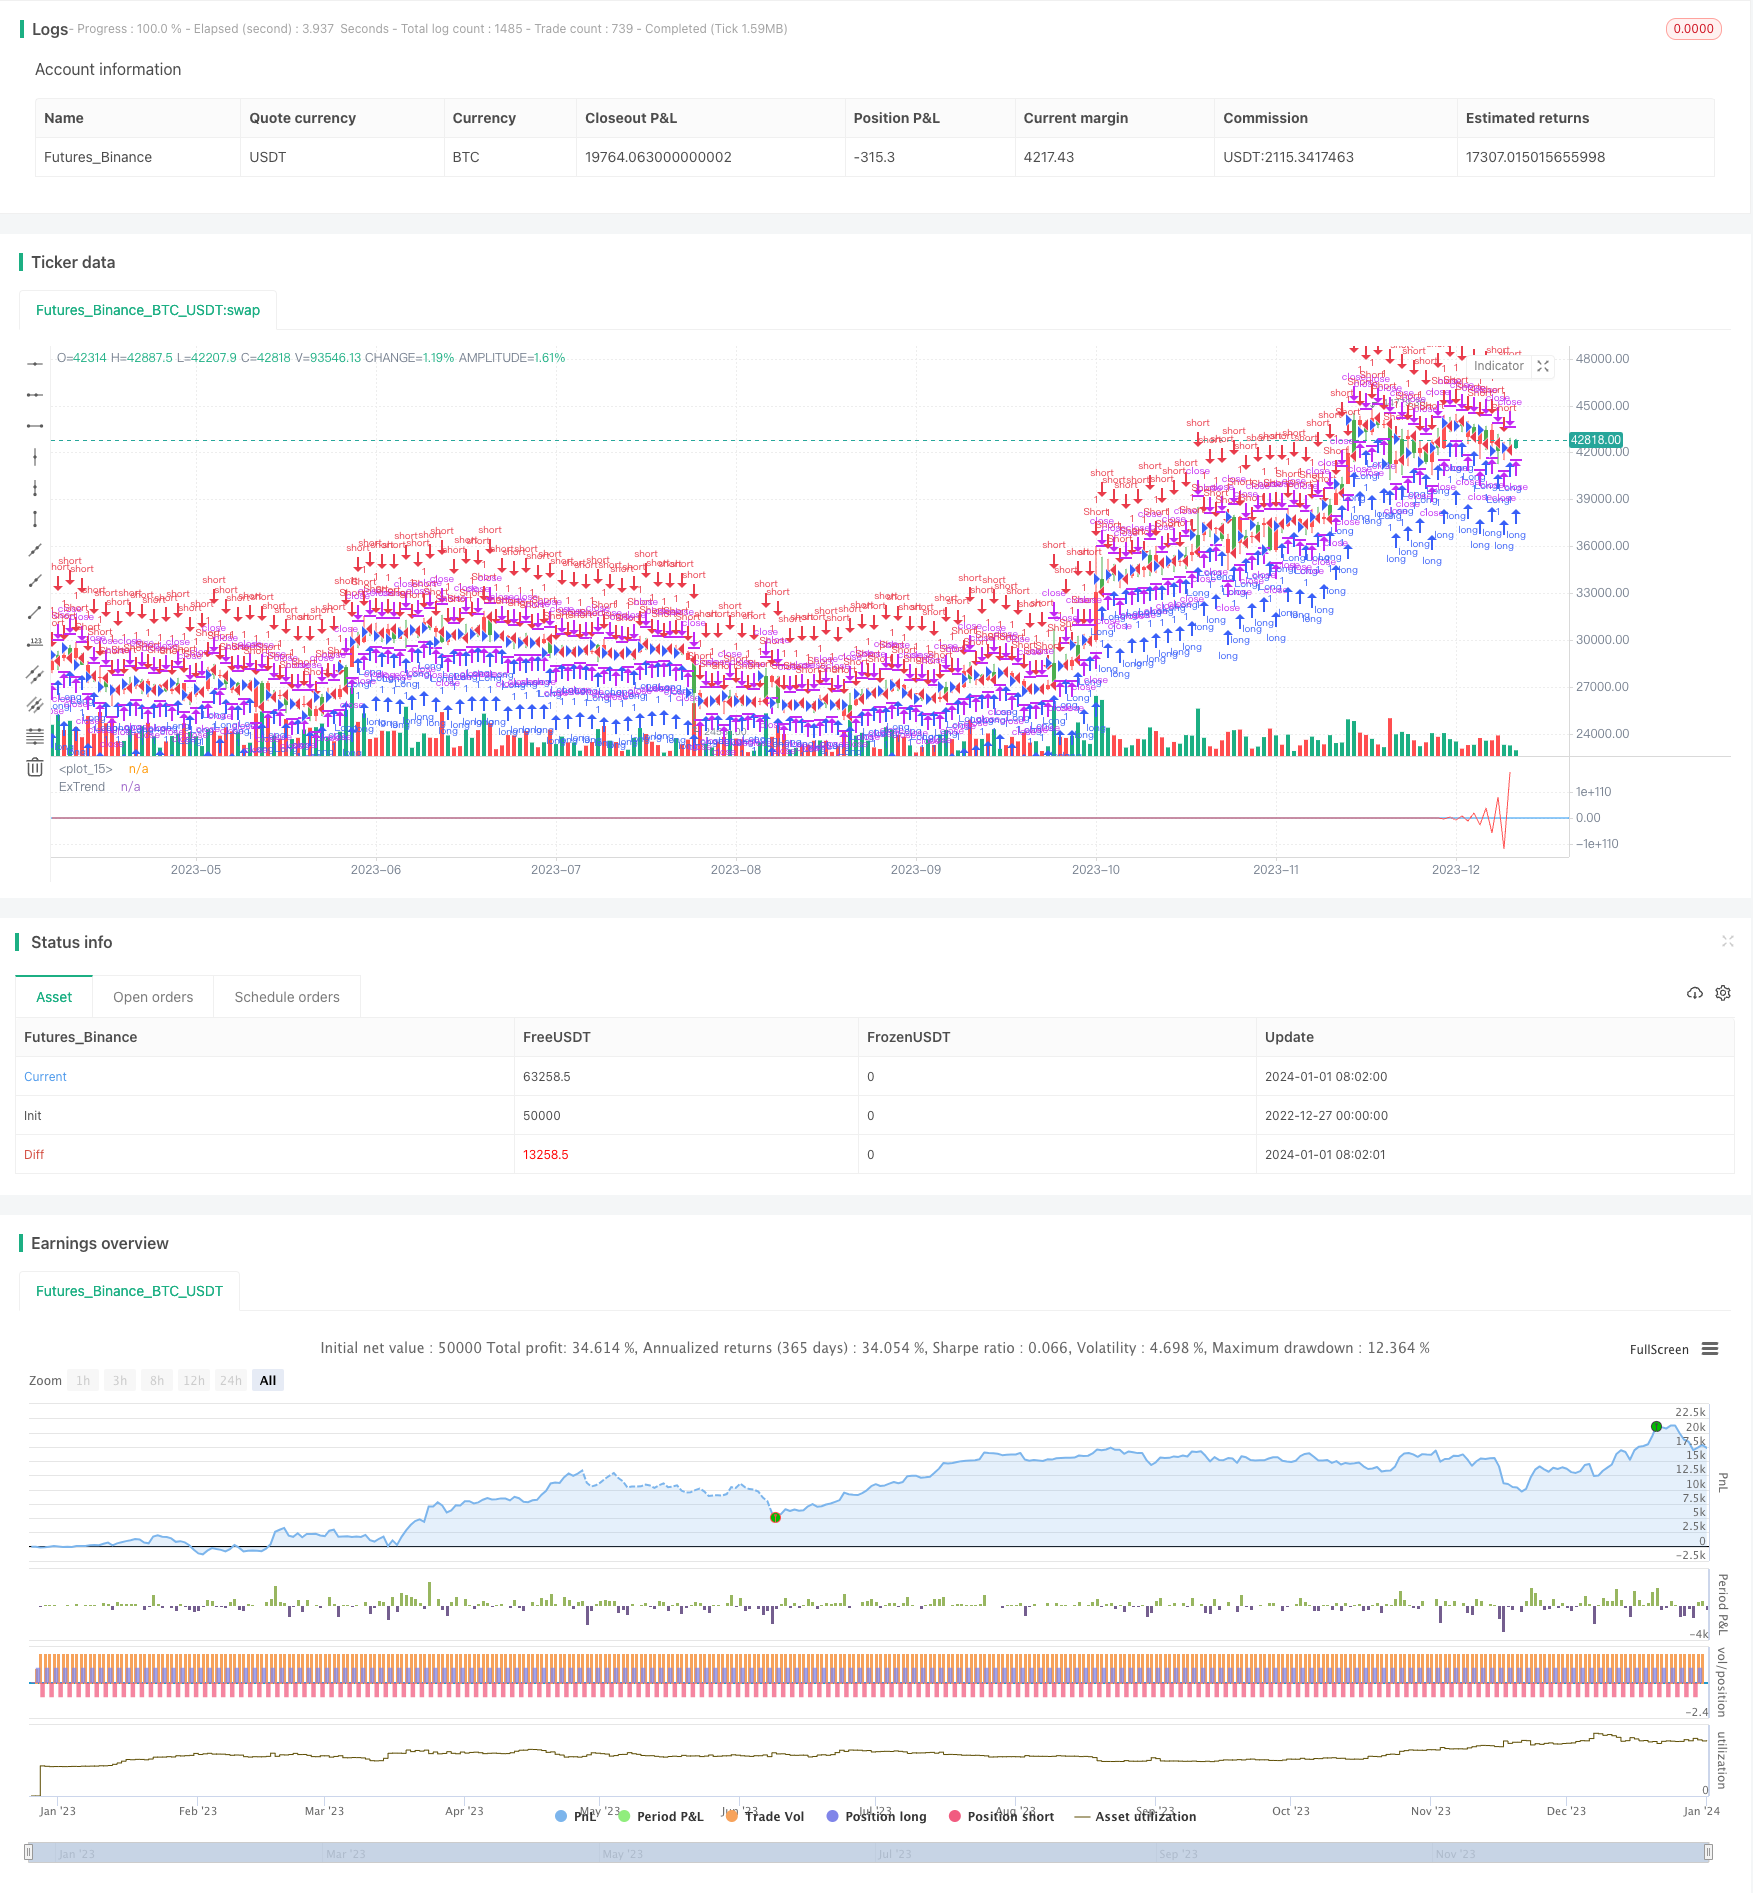
概述
带通滤波趋势提取策略是一种基于带通滤波器的股票趋势跟踪策略。该策略使用指数加权移动平均线和带通滤波进行价格序列处理,提取出价格中的趋势成分,并以一定的参数作为建仓和平仓的信号。
策略原理
该策略首先构建一个双次指数加权移动平均线,通过调节参数Length和Delta控制移动平均线的时间长度和平滑度。然后使用一组数学变换,提取价格序列中的趋势成分,存储在xBandpassFilter变量中。最后计算xBandpassFilter的简单移动平均xMean作为建仓和平仓的指标。
当xMean上穿参数Trigger设定的水平时做多头,当下穿时做空头。可以通过调节Trigger水平控制建仓和平仓的灵敏度。
优势分析
- 使用双次指数加权移动平均线能有效滤除价格序列中的部分噪声,使得策略更稳定。
- 带通滤波器只提取价格序列中的趋势成分,避免被震荡行情误导,使策略更加稳定可靠。
- 策略参数较少,容易调优和控制风险。
风险分析
- 策略存在时间滞后,可能错过价格快速反转的机会。
- 双次指数加权移动平均线和带通滤波器都有低通滤波的效果,会过滤掉高频信号,降低策略的灵敏度。
- 如果参数设定不当,过滤效果过强,可能错过较强的趋势机会。
可以通过适当缩短Length参数改善滞后问题,调节Trigger水平控制策略的灵敏度。
优化方向
- 可以考虑加入止损策略控制单笔损失。
- 可以通过短期和长期双均线系统改善策略的稳定性。
- 可以结合市场交易量等其他指标判断反转信号,避免在震荡行情中被套牢。
- 可以使用机器学习或遗传算法优化参数,使策略更加稳定可靠。
总结
该策略整体较为稳定,在强势趋势市场中表现较好。可以通过多种方式进一步优化,使其在更多市场环境下保持稳定盈利。该策略值得进一步研究和应用。
策略源码
/*backtest
start: 2022-12-27 00:00:00
end: 2024-01-02 00:00:00
period: 1d
basePeriod: 1h
exchanges: [{"eid":"Futures_Binance","currency":"BTC_USDT"}]
*/

//@version = 2
////////////////////////////////////////////////////////////
//  Copyright by HPotter v1.0 14/12/2016
// The related article is copyrighted material from Stocks & Commodities Mar 2010
//
// You can use in the xPrice any series: Open, High, Low, Close, HL2, HLC3, OHLC4 and ect...
// You can change long to short in the Input Settings
// Please, use it only for learning or paper trading. Do not for real trading.
////////////////////////////////////////////////////////////
strategy(title="Extracting The Trend Strategy Backtest")
Length = input(20, minval=1)
Delta = input(0.5)
Trigger = input(0)
reverse = input(false, title="Trade reverse")
hline(Trigger, color=blue, linestyle=line)
xPrice = hl2
beta = cos(3.1415 * (360 / Length) / 180)
gamma = 1 / cos(3.1415 * (720 * Delta / Length) / 180)
alpha = gamma - sqrt(gamma * gamma - 1)
xBandpassFilter = 0.5 * (1 - alpha) * (xPrice - xPrice[2]) + beta * (1 + alpha) * nz(xBandpassFilter[1]) - alpha * nz(xBandpassFilter[2])
xMean = sma(xBandpassFilter, 2 * Length)
pos = iff(xMean > Trigger, 1,
	   iff(xMean < Trigger, -1, nz(pos[1], 0)))
possig = iff(reverse and pos == 1, -1,
          iff(reverse and pos == -1, 1, pos))
if (possig == 1)
    strategy.entry("Long", strategy.long)
if (possig == -1)
    strategy.entry("Short", strategy.short)
barcolor(possig == -1 ? red: possig == 1 ? green : blue )
plot(xMean, color=red, title="ExTrend")