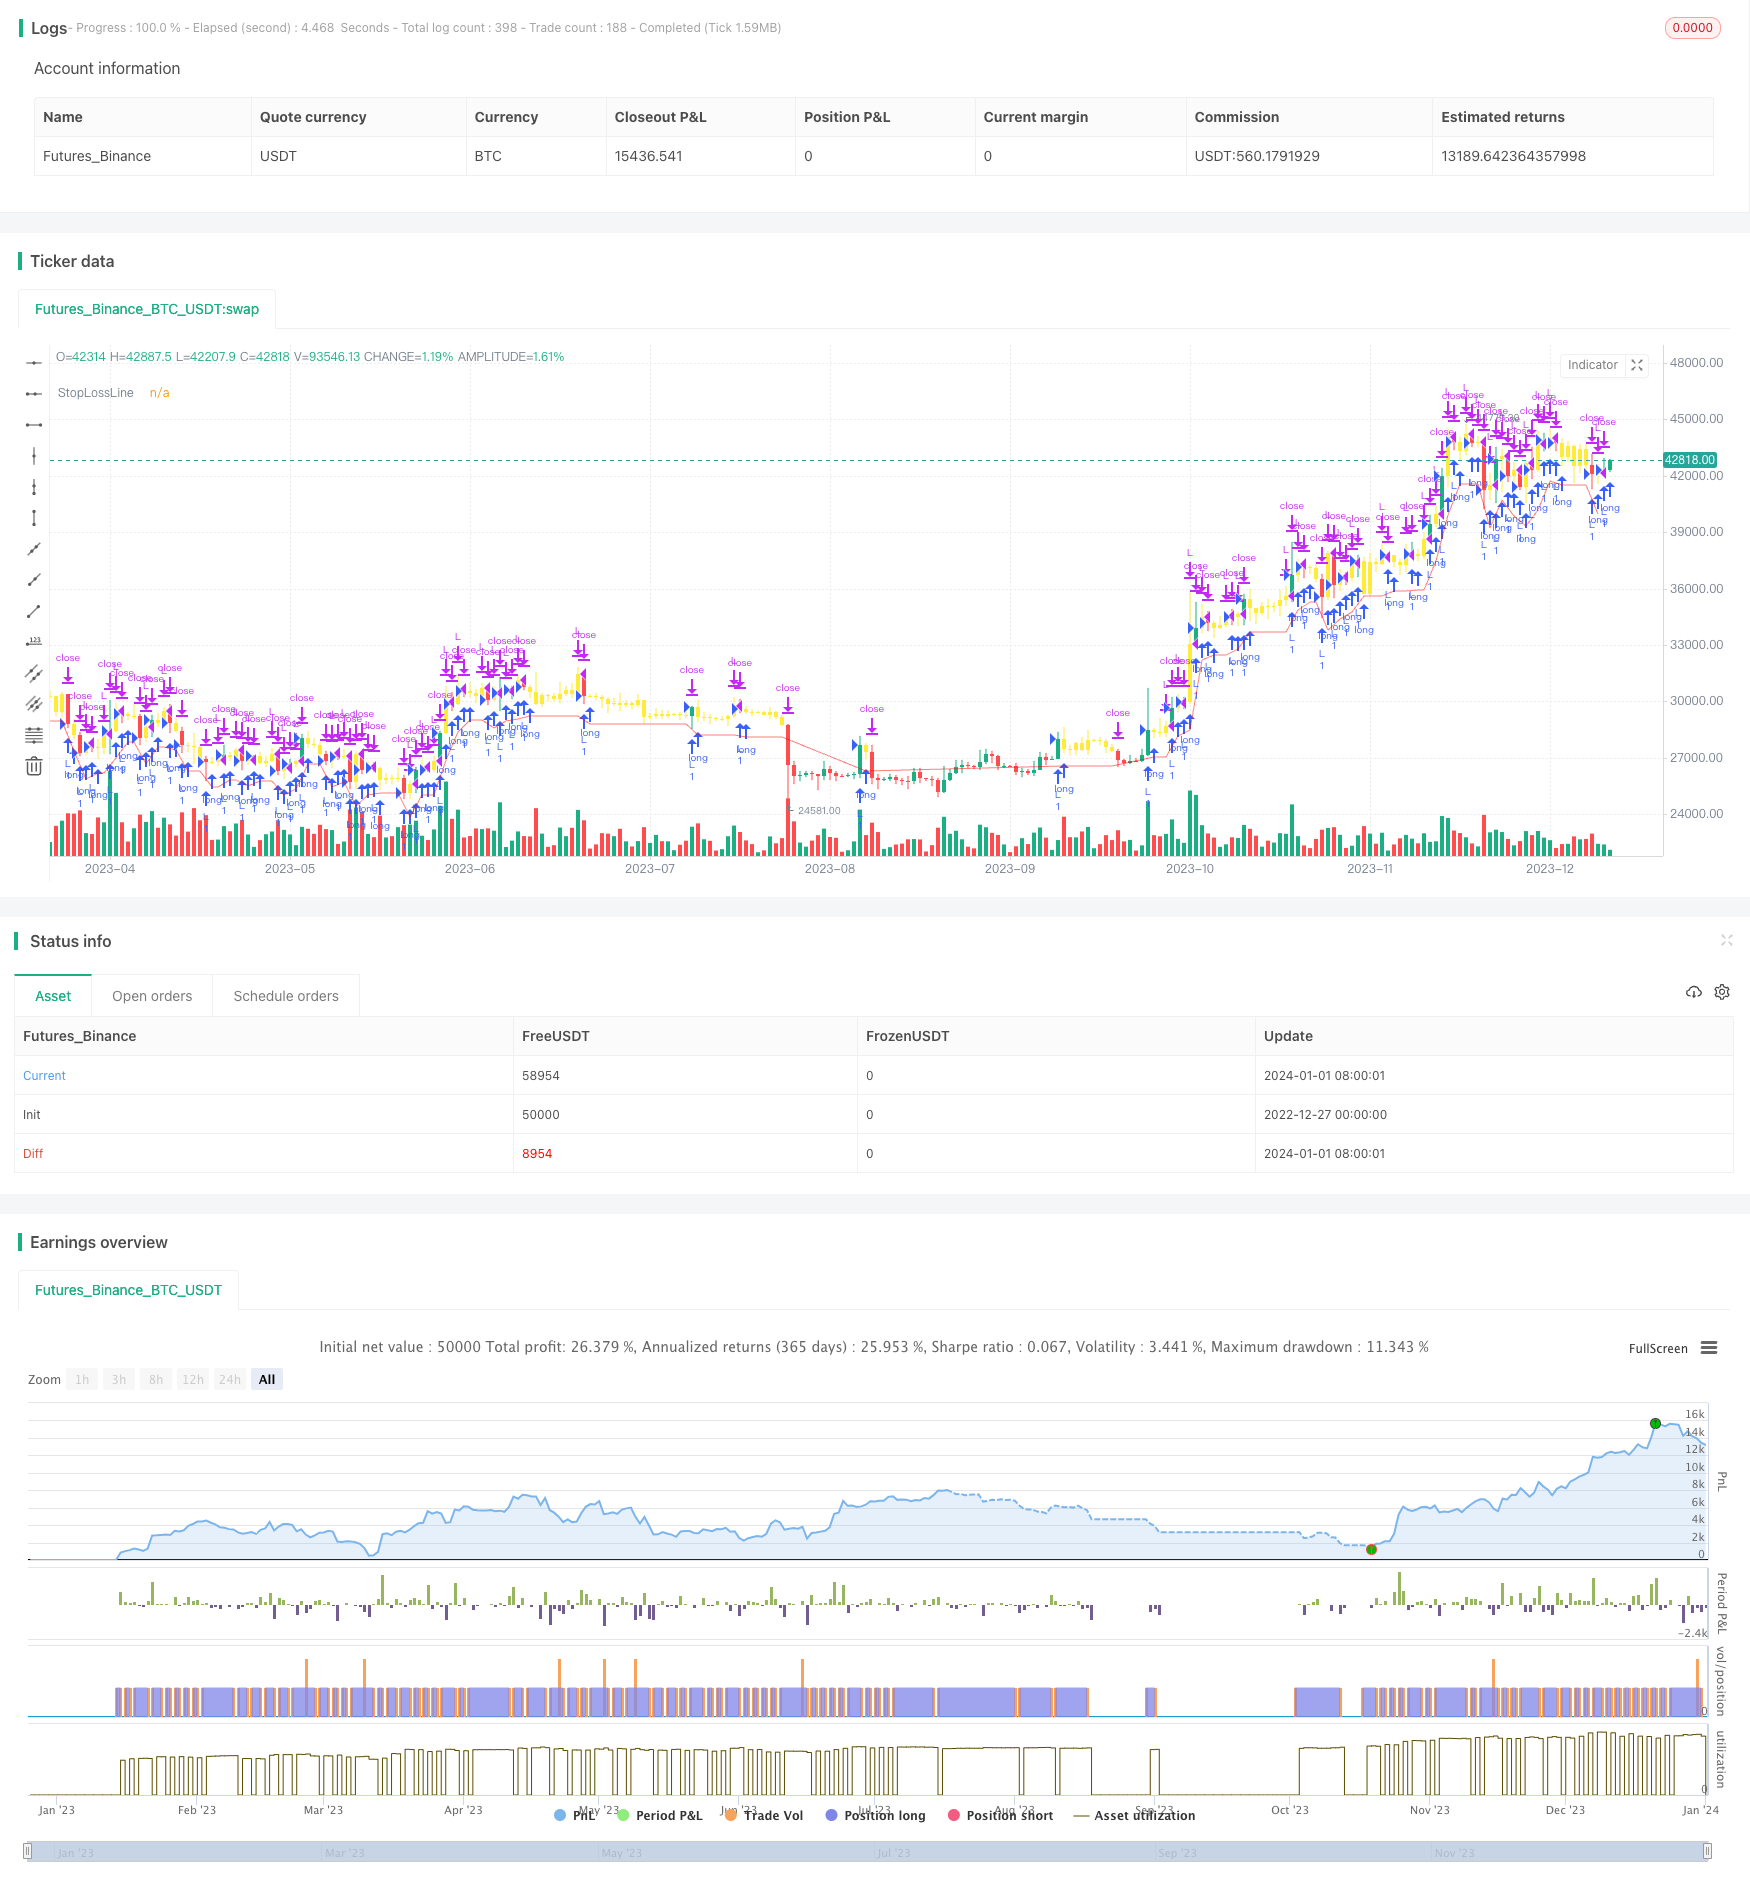
概述
该策略的主要思想是在当天收盘前买入,次日开盘后判断价格是否高于买入价格,如果高于则止盈卖出,如果没有高于则继续持有直到止损或止盈。
策略原理
该策略首先设置了200日简单移动平均线作为市场状态判断的指标,只有当价格高于200日线时才允许交易。另外设置了每天的买入时间为收盘前半小时内,卖出时间为次日开盘后半小时内。在买入时间如果市场状态符合就市价买入,在卖出时间判断价格是否高于买入价格,如果高于就市价卖出止盈,如果没有高于则继续持有直到止损或者在明天的卖出时间再次判断。同时设置了5%的止损线来防止亏损扩大。
优势分析
该策略有以下几个优势:
利用了收盘效应,收盘时波动较大,容易形成较大的缺口,次日开盘价格可能会有较大幅度的涨跌。
通过较短的持有期限,可以快速止损止盈,降低风险。
比较简单的逻辑,容易理解和实现。
可以灵活设置止损线和市场状态判断指标来控制风险。
风险分析
该策略也存在一些风险:
收盘时买入可能价格高位买入,增加亏损风险。
持有期短,容易被套牢。如果次日没有涨跌停可能会被套持。
依赖较大的缺口出现,如果没有缺口则可能亏损或套持。
如果选错标的,例如股指横盘,则可能多次亏损。
对应解决方法:
可以结合技术指标判断收盘时是否处于相对低位。
可以适当拉长持有期,例如持有2-3天。
选择有效突破时机位才买入。
做好标的筛选,选择有上涨趋势的标的。
优化方向
该策略还可以从以下几个方面来优化:
在买入条件上加入更多技术指标判断,确保收盘买入时机确定性更高。
测试不同的持有周期,找到最优止盈时间。
对止损线进行优化,找到最优止损点。
测试在具体哪些标的和市场环境下表现更好,采用动态的标的和仓位管理。
总结
本策略整体思路清晰,利用收盘效应形成的缺口来进行快节奏的止盈止损交易。具有操作简单,容易实现等优点。但也存在被套风险较大,选股和止损mgmt很关键。后期可从确定买入信号、优化持有周期和止损点、动态仓位管理等方面进行优化,在控制风险的前提下,提高系统稳定性和盈利能力。
/*backtest
start: 2022-12-27 00:00:00
end: 2024-01-02 00:00:00
period: 1d
basePeriod: 1h
exchanges: [{"eid":"Futures_Binance","currency":"BTC_USDT"}]
*/

//  @version=4
//  © HermanBrummer
//  This source code is subject to the terms of the Mozilla Public License 2.0 at https://mozilla.org/MPL/2.0/
strategy("M8 BUY @ END OF DAY", "", 1)

///         BUYS AT THE END OF THE DAY
///         SELLS THE NEXT MORNING IF PRICE IS HIGHER THEN THE ENTRY PRICE
///         IF PRICE IS NOT HIGHER THEN IT WILL KEEP THE POSITION AND WAIT FOR EITHER A STOP OUT OR FOR PRICE TO BE HIGHER THAN THE ENTRY
///         USES A 5% STOP LOSS ON THE REDLINE  -- SETTABLE IN SETTINGS
///         USES A 200 DAY MARKET FILTER        -- SETTABLE IN SETTINGS -- IMPORTS DATA FROM HIGHER TIMEFRAME, BUT USES CLOSE[2] << SO THIS IS FIXED, NON-REPAITING DATA


MarketFilterLen = input(200)
StopLossPerc    = input(.95, step=0.01)

buyTime         = time(timeframe.period, "1429-1500")
sellTime        = time(timeframe.period, "0925-0935")

F1              = close > sma(security(syminfo.tickerid, "D", close[2]), MarketFilterLen) // HIGH OF OLD DATA -- SO NO REPAINTING

enter           = buyTime and F1
exit            = sellTime


StopLossLine    = strategy.position_avg_price * StopLossPerc

plot(StopLossLine, "StopLossLine", color.new(#FF0000, 50))

strategy.entry("L", true, when=enter)
strategy.exit("StopLoss", stop=StopLossLine )
if  close > strategy.position_avg_price
    strategy.close("L", when=exit)

barcolor(strategy.opentrades != 0 ? color.new(color.yellow, 0) : na )