概述
黄金分割与相对强弱指标(RSI)策略是一种Intraday(盘内)交易策略。它结合了Fibonacci黄金分割法则与RSI指标,在价格接近黄金分割关键点时,判断RSI是否过度买入或卖出,以发出买入或卖出信号。
策略原理
根据一定长度的K线计算出价格的中轴线。
根据中轴线和标准差计算出黄金分割关键点,包括0.618级别和1级别。
当价格接近黄金分割关键点时,检查RSI指标是否进入超买或超卖区域。
如果同时满足黄金分割法则和RSI条件,则发出买入或卖出信号。
设置止损和止盈以控制风险。
优势分析
结合多个指标,可以提高信号质量,降低假信号。
利用黄金分割法则的支持/阻力特性,提高入场质量。
RSI指标可以判断市场心理面,避免极端情况的反转。
适合高频Intraday交易,收益可以通过多次较小交易累积。
风险分析
黄金分割法则并不能百分之百确保价格会反转。
RSI指标可能发出误导信号,需要结合价格行情判断。
止损点设定过小可能被价格震荡止损。
高频交易需要更多交易成本和更严格的风险控制。
解决方法:
严格遵守止损规则,控制单笔损失。
适当放宽RSI参数,避免误导。
优化止损点,在保证止损的同时尽量减少被止损概率。
优化方向
测试不同长度周期的参数优化结果。
尝试结合其他指标如MACD、布林带等提高信号质量。
研究不同的止损策略,寻找最优配置。
评估确定最佳的持仓时间,以平衡收益和成本。
总结
黄金分割与RSI策略通过双重确认,能过滤掉一些噪声交易。与使用单一指标相比,它可以产生更高质量的交易信号。通过参数优化和规则严格遵守,该策略可以成为有效的Intraday交易工具。
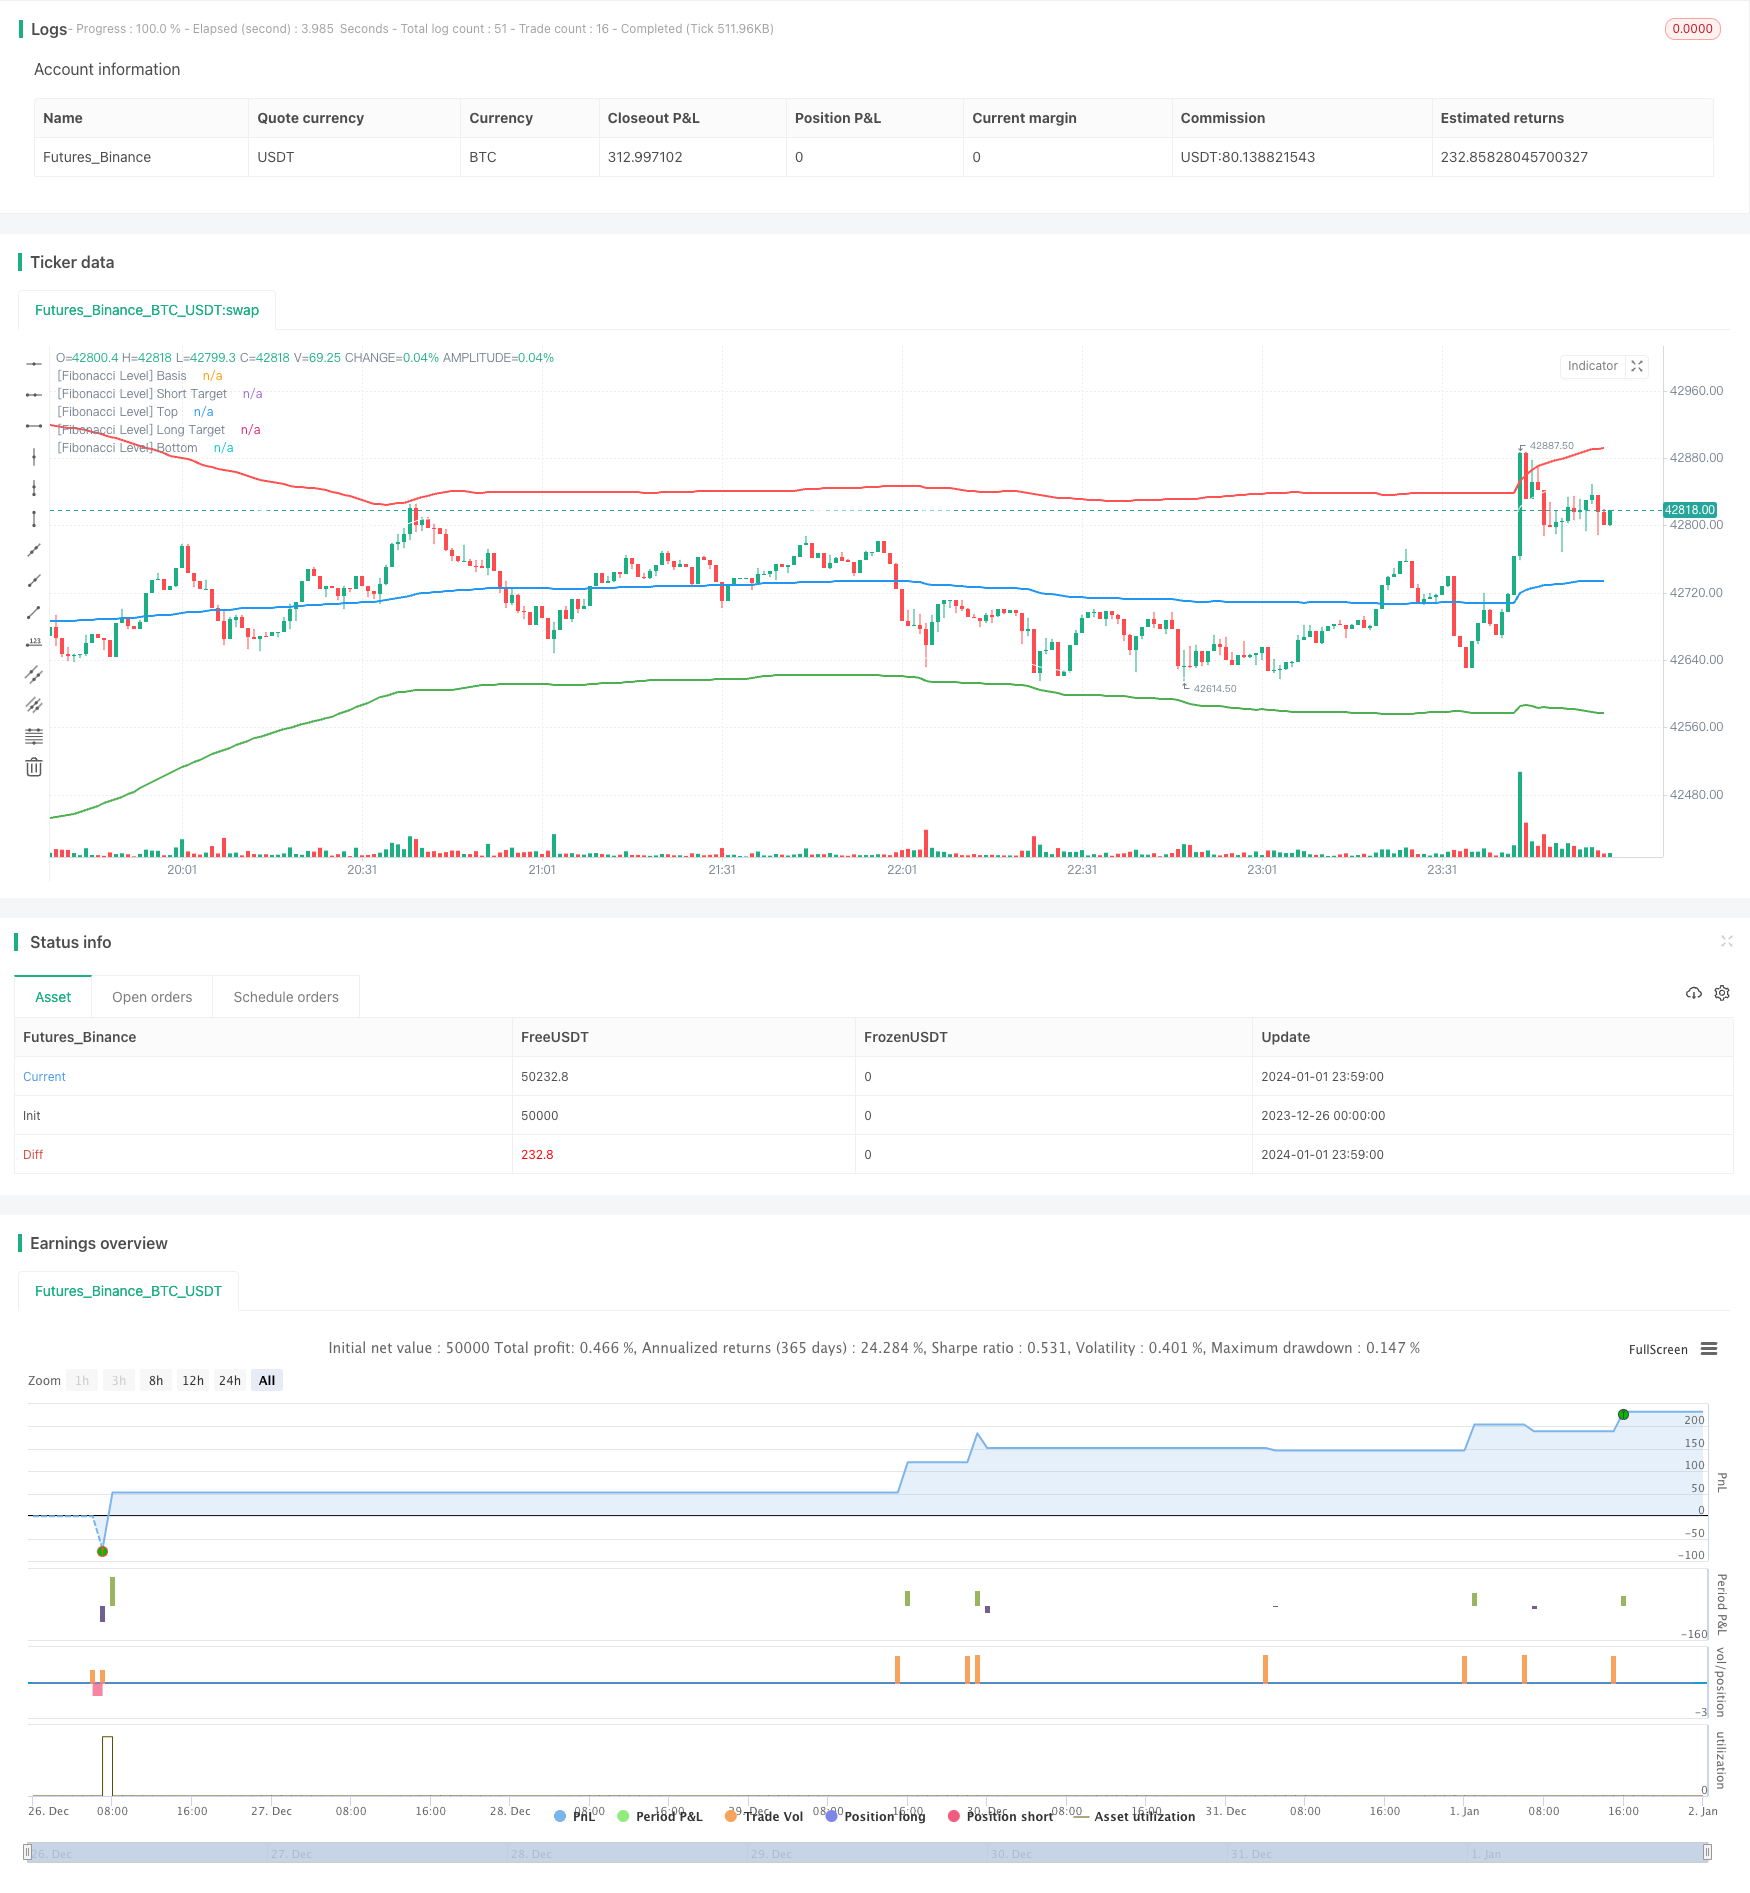
策略源码
/*backtest
start: 2023-12-26 00:00:00
end: 2024-01-02 00:00:00
period: 1m
basePeriod: 1m
exchanges: [{"eid":"Futures_Binance","currency":"BTC_USDT"}]
*/

// This source code is subject to the terms of the Mozilla Public License 2.0 at https://mozilla.org/MPL/2.0/
// © MohamedYAbdelaziz

// Intraday Trading
// Best used for Short Timeframes [1-30 Minutes]
// If you have any modifications please tell me to update it

//@version=4
strategy(title="Fibonacci + RSI - Strategy", overlay=true, default_qty_type=strategy.percent_of_equity, default_qty_value=100, initial_capital=10000, currency=currency.USD)

// Inputs
timeFilter = year >= 2000
    // Stop Loss %
loss_percent = input(title="Stop Loss (%)", minval=0.0, step=0.1, defval=2) * 0.001
    // RSI Inputs
len = input(title="[RSI] Length", minval=0, step=1, defval=14)
overSold = input(title="[RSI] Over Sold %", defval=30)
overBought = input(title="[RSI] Over Bought %", defval=70)
    // Fibonacci Levels
length = input(title="[Fibonacci] Length", defval=200, minval=1)
src = input(hlc3, title="[Fibonacci] Source")
mult = input(title="[Fibonacci] Multiplier", defval=3.0, minval=0.001, maxval=50)
level = input(title="[Fibonacci] Level", defval=764)


// Calculate Fibonacci
basis = vwma(src, length)
dev = mult * stdev(src, length)
fu764= basis + (0.001*level*dev)
fu1= basis + (1*dev)
fd764= basis - (0.001*level*dev)
fd1= basis - (1*dev)

// Calculate RSI
vrsi = rsi(close, len)

// Calculate the Targets
targetUp = fd764
targetDown = fu764
    // Actual Targets
bought = strategy.position_size[0] > strategy.position_size[1]
exit_long = valuewhen(bought, targetUp, 0)
sold = strategy.position_size[0] < strategy.position_size[1]
exit_short = valuewhen(sold, targetDown, 0)

// Calculate Stop Losses
stop_long = strategy.position_avg_price * (1 - loss_percent)
stop_short = strategy.position_avg_price * (1 + loss_percent)

// Conditions to Open Trades
openLong = low < fd1 and crossover(vrsi[1], overSold)
openShort = high > fu1 and crossunder(vrsi[1], overBought)

// Conditions to Close Trades
closeLong = high > exit_long
closeShort = low < exit_short


// Plots
plot(basis, color=color.blue, linewidth=2, title="[Fibonacci Level] Basis")
plot(fu764, color=color.white, linewidth=1, title="[Fibonacci Level] Short Target")
plot(fu1, color=color.red, linewidth=2, title="1", title="[Fibonacci Level] Top")
plot(fd764, color=color.white, linewidth=1, title="[Fibonacci Level] Long Target")
plot(fd1, color=color.green, linewidth=2, title="1", title="[Fibonacci Level] Bottom")


// Strategy Orders
if timeFilter
    // Entry Orders
    strategy.entry(id="Long", long=true, when=openLong and high < targetUp, limit=close)
    strategy.entry(id="Short", long=false, when=openShort and low > targetDown, limit=close)

    // Exit Orders
    strategy.exit(id="Long", when=closeLong and strategy.position_size > 0, limit=exit_long, stop=stop_long)
    strategy.exit(id="Short", when=closeShort and strategy.position_size < 0, limit=exit_short, stop=stop_short)