概述
该策略通过计算双均线的交叉来判断价格趋势,并结合一定的参数限制来发出买入和卖出信号。主要分为三部分:第一,通过计算快速均线和慢速均线的交叉来判断价格趋势;第二,结合一定的参数限制来避免错误交易;第三,利用止盈止损来控制风险。
策略原理
该策略的核心在于计算快速均线和慢速均线。快速均线参数为均线周期的一半,反应价格变化更加敏感;慢速均线参数为均线周期,反应价格变化更加平稳。当快速均线上穿慢速均线时,认为价格进入上升趋势;当快速均线下穿慢速均线时,认为价格进入下降趋势。
此外,策略还设置了一定的参数来避免错误交易。如设置了决策阈值,只有快慢均线差值超过一定幅度时才会发出交易信号;confidence参数用于波动过滤,只有价格波动达到一定程度才会发出信号。
最后,策略采用止盈止损来控制风险。 openprofit小于止损点就退出仓位,超过止盈点就退出仓位,有效控制单笔损失。
优势分析
该策略最大的优势在于结合均线指标判断价格趋势和波动特征。双均线交叉判断价格趋势是经典有效的技术指标方法,参数优化后可准确抓取趋势;波动性指标confidence可有效过滤震荡市,避免频繁错误交易。
此外,决策阈值、止盈止损等参数设置也可大大降低交易风险,避免追高杀跌。
风险分析
该策略主要风险在于双均线指标发出错误信号的可能。快速均线和慢速均线均为加权移动平均线,对突发事件反应较慢,可能错过短期价格反转。此时就要依赖参数confidence进行双重过滤。
此外,止盈止损点设置不当也会增大风险。止盈点过高、止损点过低都可能造成超出预期的损失。这需要根据不同品种特点和波动率来设置合理的参数。
优化方向
该策略可从以下几个方面进行优化:
优化均线周期,设置自适应均线,使其能更好地对不同周期的价格波动进行建模;
设置止盈止损动态跟踪机制,通过行情实时计算波动率,使止盈止损点能够动态变化;
增加机器学习模型判断价格趋势方向,利用更多历史数据判断当前价格走向,减少错误信号。
总结
该策略整体来说是一种经典简单有效的趋势交易策略。采用双均线交叉判定趋势,参数设置进行风险控制,可配置性强,适用于多品种交易。如果能引入机器学习等更加智能的判断手段,整体效果会更好,值得进一步研究。
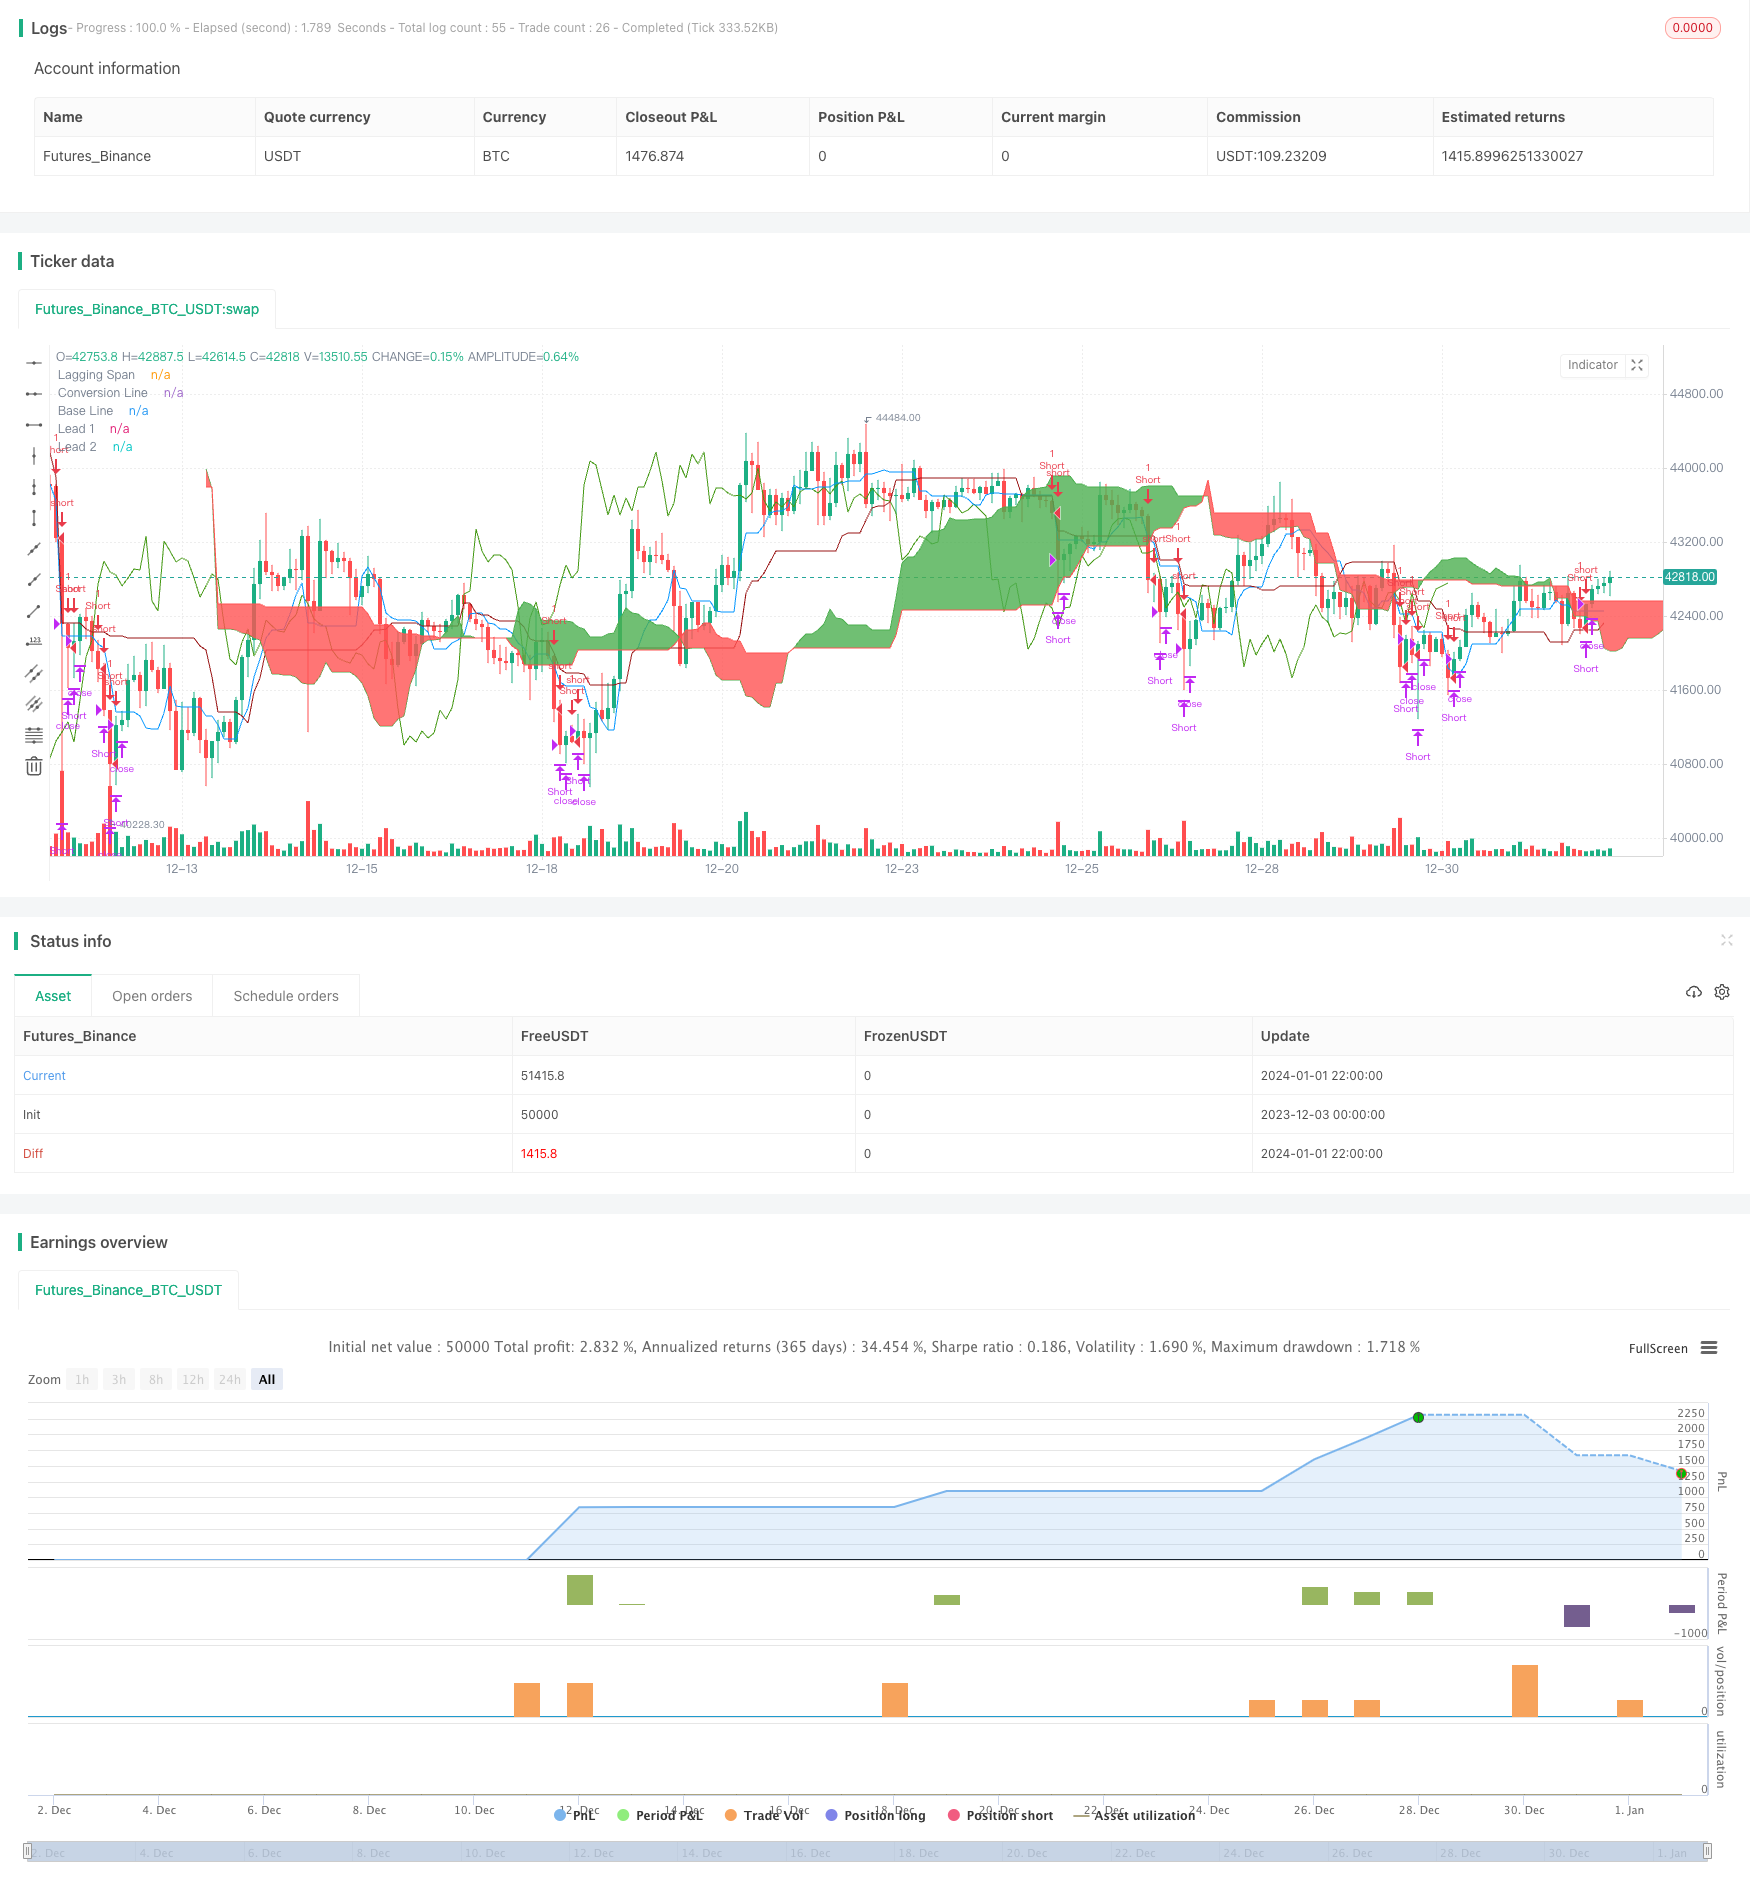
/*backtest
start: 2023-12-03 00:00:00
end: 2024-01-02 00:00:00
period: 2h
basePeriod: 15m
exchanges: [{"eid":"Futures_Binance","currency":"BTC_USDT"}]
*/

//@version=2
// Any timeFrame ok but good on 15 minute & 60 minute , Ichimoku + Daily-Candle_cross(DT) + HULL-MA_cross + MacD combination 420 special blend
strategy("Trade Signal", shorttitle="Trade Alert", overlay=true )
keh=input(title="Double HullMA",defval=14, minval=1)
dt = input(defval=0.0010, title="Decision Threshold (0.001)", type=float, step=0.0001)
SL = input(defval=-10.00, title="Stop Loss in $", type=float, step=1)
TP = input(defval=100.00, title="Target Point in $", type=float, step=1)
ot=1
n2ma=2*wma(close,round(keh/2))
nma=wma(close,keh)
diff=n2ma-nma
sqn=round(sqrt(keh))
n2ma1=2*wma(close[1],round(keh/2))
nma1=wma(close[1],keh)
diff1=n2ma1-nma1
sqn1=round(sqrt(keh))
n1=wma(diff,sqn)
n2=wma(diff1,sqn)
b=n1>n2?lime:red
c=n1>n2?green:red
d=n1>n2?red:green
confidence=(request.security(syminfo.tickerid, '5', close[1])-request.security(syminfo.tickerid, '60', close[1]))/request.security(syminfo.tickerid, '60', close[1])
conversionPeriods = input(9, minval=1, title="Conversion Line Periods")
basePeriods = input(26, minval=1, title="Base Line Periods")
laggingSpan2Periods = input(52, minval=1, title="Lagging Span 2 Periods")
displacement = input(26, minval=1, title="Displacement")
donchian(len) => avg(lowest(len), highest(len))
conversionLine = donchian(conversionPeriods)
baseLine = donchian(basePeriods)
leadLine1 = avg(conversionLine, baseLine)
leadLine2 = donchian(laggingSpan2Periods)
LS=close, offset = -displacement
MACD_Length = input(9)
MACD_fastLength = input(12)
MACD_slowLength = input(26)
MACD = ema(close, MACD_fastLength) - ema(close, MACD_slowLength)
aMACD = ema(MACD, MACD_Length)
closelong = n1<n2 and close<n2 and confidence<dt or strategy.openprofit<SL or strategy.openprofit>TP
if (closelong)
    strategy.close("Long")
closeshort = n1>n2 and close>n2 and confidence>dt or strategy.openprofit<SL or strategy.openprofit>TP
if (closeshort)
    strategy.close("Short")
longCondition = n1>n2 and strategy.opentrades<ot and confidence>dt and close>n2 and leadLine1>leadLine2 and open<LS and MACD>aMACD
if (longCondition)
    strategy.entry("Long",strategy.long)
shortCondition = n1<n2 and strategy.opentrades<ot and confidence<dt and close<n2 and leadLine1<leadLine2 and open>LS and MACD<aMACD
if (shortCondition)
    strategy.entry("Short",strategy.short)

//alerts
alertcondition(closelong, title='Close Buy Position', message='Close Buy Position')
alertcondition(closeshort, title='Close Short Position', message='Close Short Position')
alertcondition(longCondition, title='Buy Signal', message='Buy Signal Alert')
alertcondition(shortCondition, title='Sell Signal', message='Sell Signal Alert')

//a1=plot(n1,color=c)
//a2=plot(n2,color=c)plot(cross(n1, n2) ? n1 : na, style = circles, color=b, linewidth = 4)
//plot(cross(n1, n2) ? n1 : na, style = line, color=d, linewidth = 4)
plot(conversionLine, color=#0496ff, title="Conversion Line")
plot(baseLine, color=#991515, title="Base Line")
plot(close, offset = -displacement, color=#459915, title="Lagging Span")
p1=plot (leadLine1, offset = displacement, color=green,  title="Lead 1")
p2=plot (leadLine2, offset = displacement, color=red,  title="Lead 2")
fill(p1, p2, color = leadLine1 > leadLine2 ? green : red)
// remove the "//" from before the plot script if want to see the indicators on chart