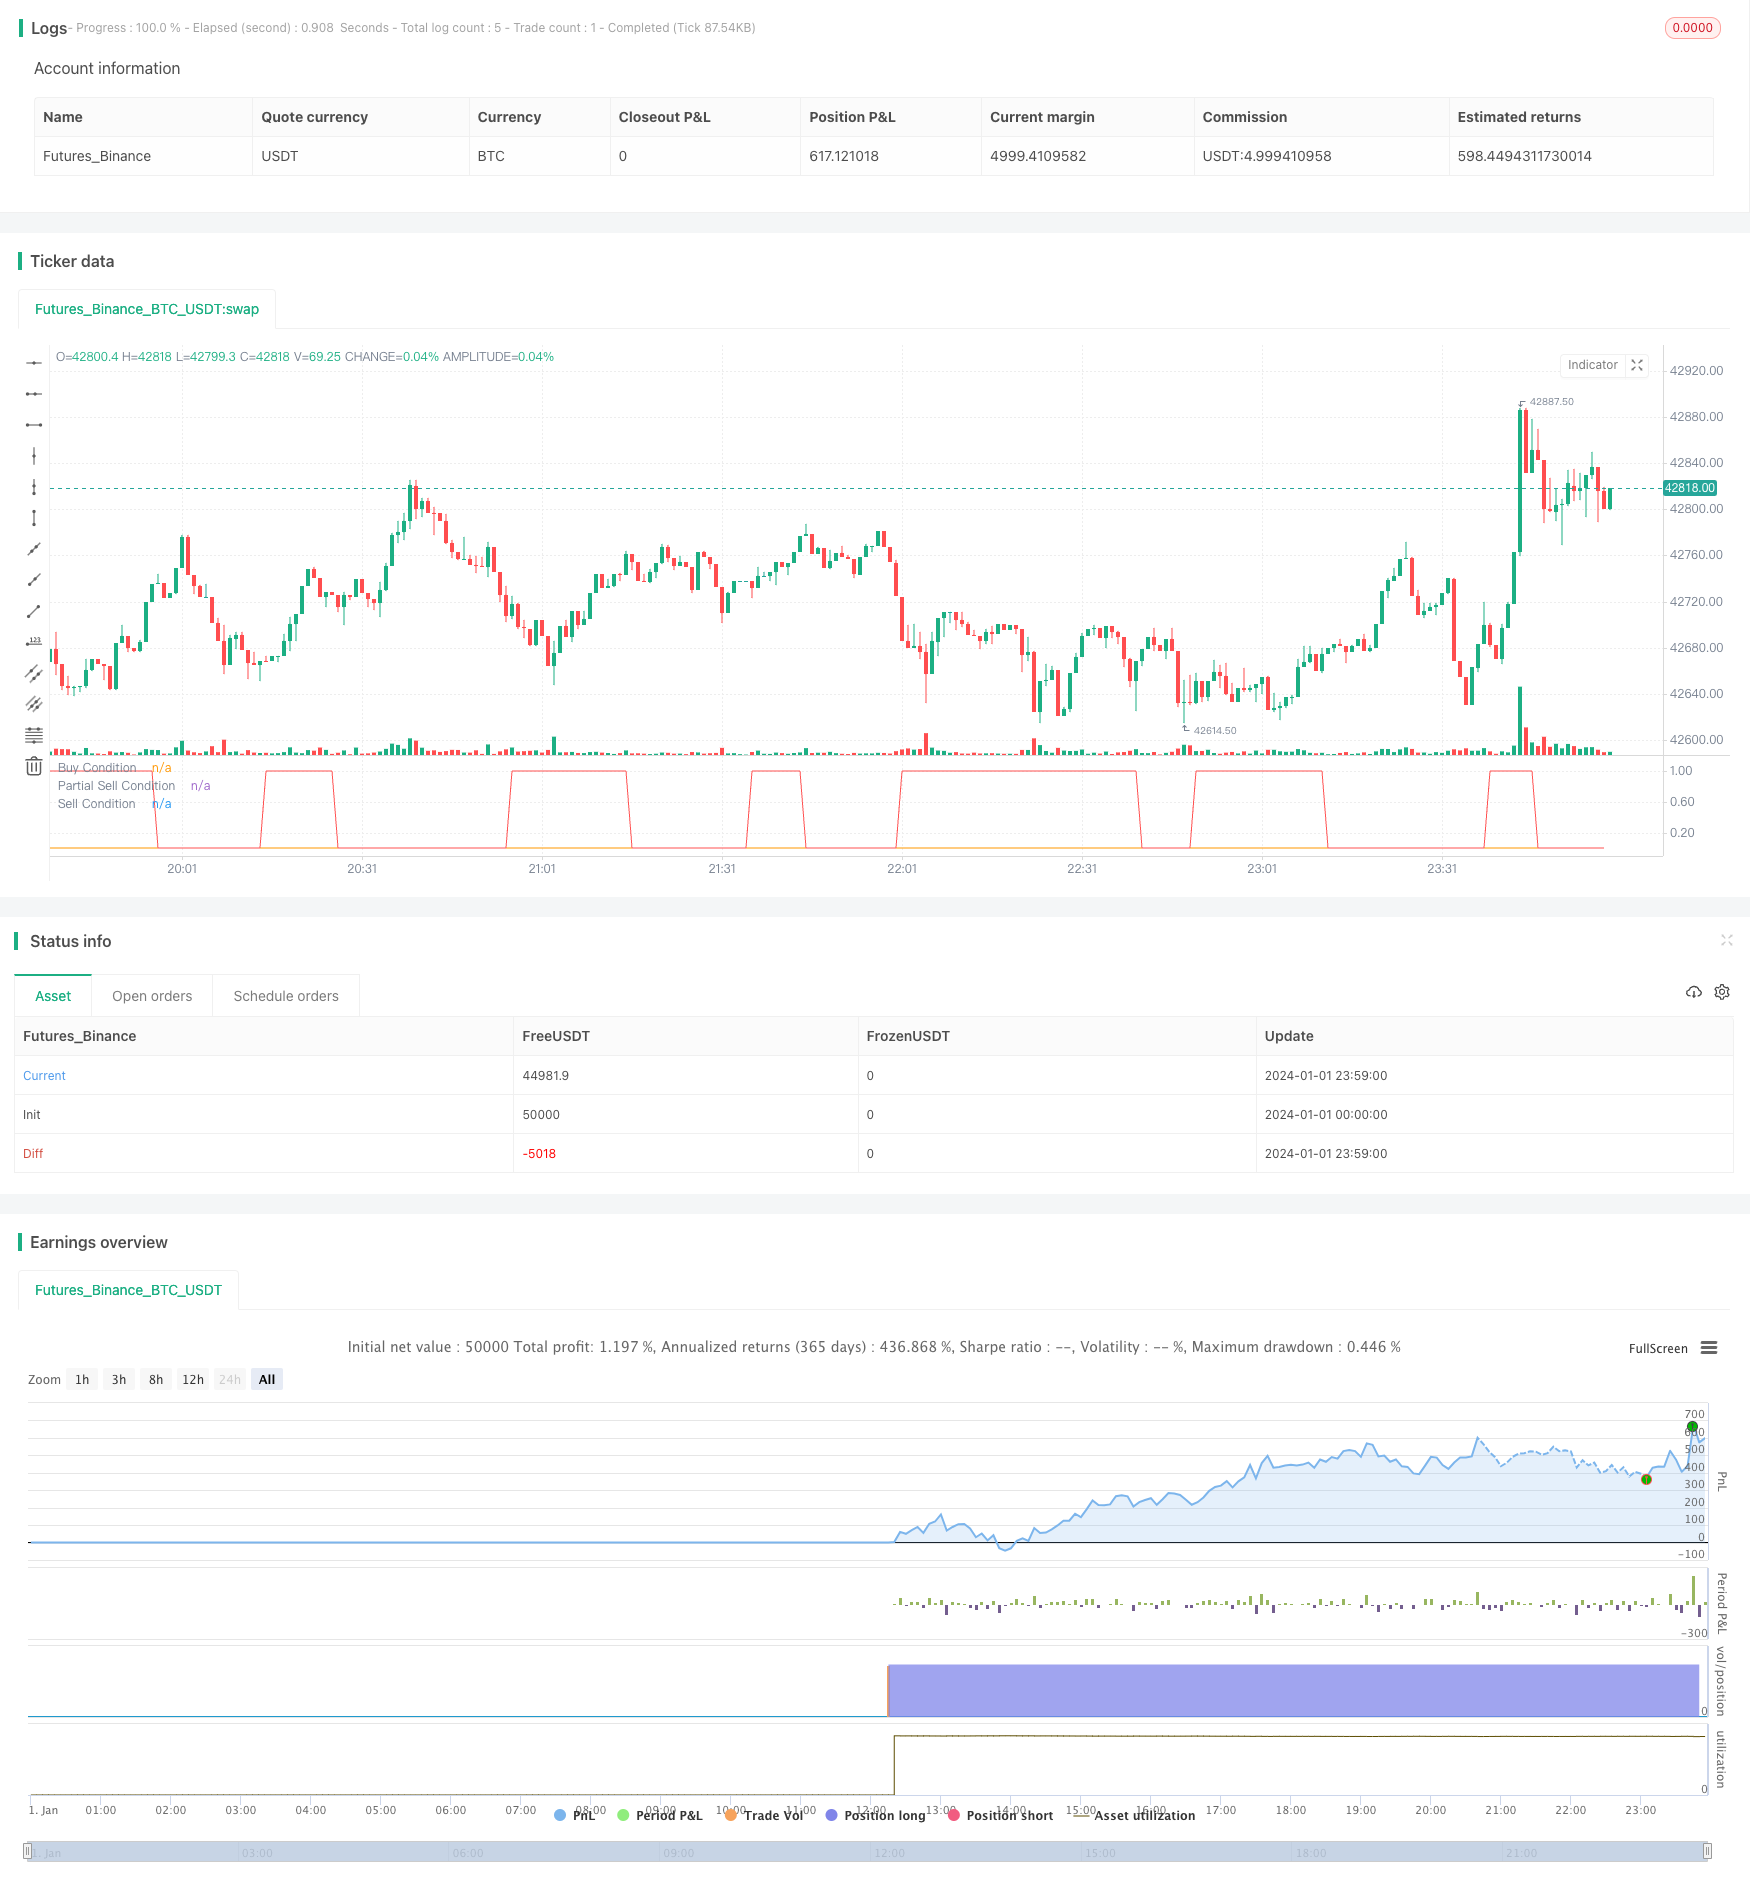
概述
该策略是一个基于移动平均线和相对强弱指标的动量反转策略。它利用快速移动平均线和慢速移动平均线的交叉以及超买超卖信号来判断Entry和Exit。
策略原理
该策略使用14日移动平均线作为快速信号线,28日移动平均线作为慢速线。同时结合RSI指标判断市场是否超买超卖。
当14日移动平均线上穿28日移动平均线且RSI低于30或者RSI低于13时,判断行情反转,做多入场。当14日移动平均线下穿28日移动平均线时,判断动量反转失效,部分止盈出场。
此外,策略还设置部分止盈机制。当持仓收益达到设定的止盈点(默认8%)时,会部分止盈(默认卖出50%)。
优势分析
该策略结合移动平均线的优势,同时避免 whipsaw 带来的损失。
利用快慢移动平均线过滤掉部分噪音。
RSI指标判断超买超卖,避免追高。
部分止盈机制锁定部分利润,降低风险。
风险分析
双移动平均线交叉策略容易产生 whipsaw,从而带来损失。此策略通过 RSI 指标进行辅助判断,可过滤掉部分 whipsaw。
部分止盈可能导致错过更大行情。可通过调整止盈点来平衡风险和收益。
优化方向
可测试不同参数的移动平均线组合,寻找最优参数。
可测试不同的 RSI 阈值。
可调整部分止盈的止盈点和卖出比例,平衡风险收益。
总结
该策略整体来说是一个典型的反转策略。它利用快慢均线的交叉判断市场反转并结合 RSI 指标过滤信号。同时设置部分止盈来锁定部分利润。该策略简单实用,可通过参数调整来适应不同市场。
策略源码
/*backtest
start: 2024-01-01 00:00:00
end: 2024-01-02 00:00:00
period: 1m
basePeriod: 1m
exchanges: [{"eid":"Futures_Binance","currency":"BTC_USDT"}]
*/

//@version=3
strategy(title = "14/28 SMA and RSI", shorttitle = "14/28 SMA and RSI", overlay = false, pyramiding = 0, default_qty_type = strategy.percent_of_equity, default_qty_value = 100, currency = currency.USD)
src = close, len = input(14, minval=1, title="Length")
take_Profit=input(8, title="Take Profit")
quantityPercentage=input(50, title="Percent of Quantity to Sell")
closeOverbought=input(true, title="Close Overbought and Take Profit")
up = rma(max(change(src), 0), len)
down = rma(-min(change(src), 0), len)
rsi = down == 0 ? 100 : up == 0 ? 0 : 100 - (100 / (1 + up / down))
longCondition = 0
sellCondition = 0
takeProfit = 0
quantityRemainder = 100
smaSignal = input(14, title="SMA Signal Period")
smaLong = input(28, title="SMA Longer Period")
if ((sma(close, smaSignal) >= sma(close, smaLong) and rsi<= 30) or (rsi<=13)) and strategy.position_size==0
    longCondition:=1

if longCondition==1
    strategy.entry("Buy", strategy.long)

profit = ((close-strategy.position_avg_price)/strategy.position_avg_price) * 100

if sma(close, smaSignal) <= sma(close, smaLong) and strategy.position_size>1
    sellCondition := 1

if strategy.position_size>=1
    if closeOverbought == true
        if profit>=take_Profit and takeProfit == 0
            strategy.exit("Take Profit", profit=take_Profit, qty_percent=quantityPercentage)
            takeProfit:=1
            quantityRemainder:=100-quantityPercentage
    if sellCondition == 1 and quantityRemainder<100
        strategy.close("Buy")

    if closeOverbought == false and rsi>70
        strategy.close("Take Profit")

plot(longCondition, "Buy Condition", green)
plot(takeProfit, "Partial Sell Condition", orange)
plot(sellCondition, "Sell Condition", red)