概述
本策略运用均线理论构建网格交易系统,通过多组不同参数的JMA均线组合判断市场趋势,并在趋势转折点开启网格交易,旨在获取市场中长线趋势转换的利润。
策略原理
利用1-20周期不等的JMA均线组成均线组合,判断市场趋势。当短周期均线高于长周期均线时判断为上升趋势,反之,下降趋势。
在趋势转折点,即短均线从上穿下长均线或从下穿上长均线时,开启网格交易。在上升趋势中逐步建立空单;在下降趋势中逐步建立多单。
可选择是否按K线实体颜色过滤,若启用,只在红K线买入,绿K线卖出,否则不考虑K线颜色,只在趋势转折时交易。
止损方式为跟踪止损或到期止损。到期止损指策略运行周期结束时,平仓所有头寸。
优势分析
利用均线系统判断趋势,可有效判断市场中长线走势转折点。
网格交易可在无明确趋势时获取震荡市场利润。同时可配置止损以控制风险。
JMA均线参数可自定义,可针对不同周期优化,灵活度高。
可选择是否按K线实体颜色过滤,避免被假突破误导。
风险分析
大幅震荡且无明显趋势市场中,止损风险较大。
均线系统判断误差 may lead to 交易信号错误。
若启用K线过滤,有 may miss 一些trading opportunities 的风险。
若网格间距设置过大,则无法获取足够利润;若太小,则头寸过多,费用压力大。
优化方向
可以测试更多组合的参数,找到对不同品种更契合的JMA均线组合。
可以结合别的指标进行Filter,如BOLL通道,KD等,提高信号质量。
可以优化网格交易的配置,如网格间距,建仓数量等参数。
可以考虑更多类型的止损方式,如跳空止损,追踪止损等。
总结
本策略以JMA均线理论判断趋势转折,在转折点开启网格交易。可获取市场中长线行情转换的利润。可通过参数优化获得更好的策略表现。总体来说,该策略适合中长期持有,逐步跟踪趋势行情获利。
策略源码
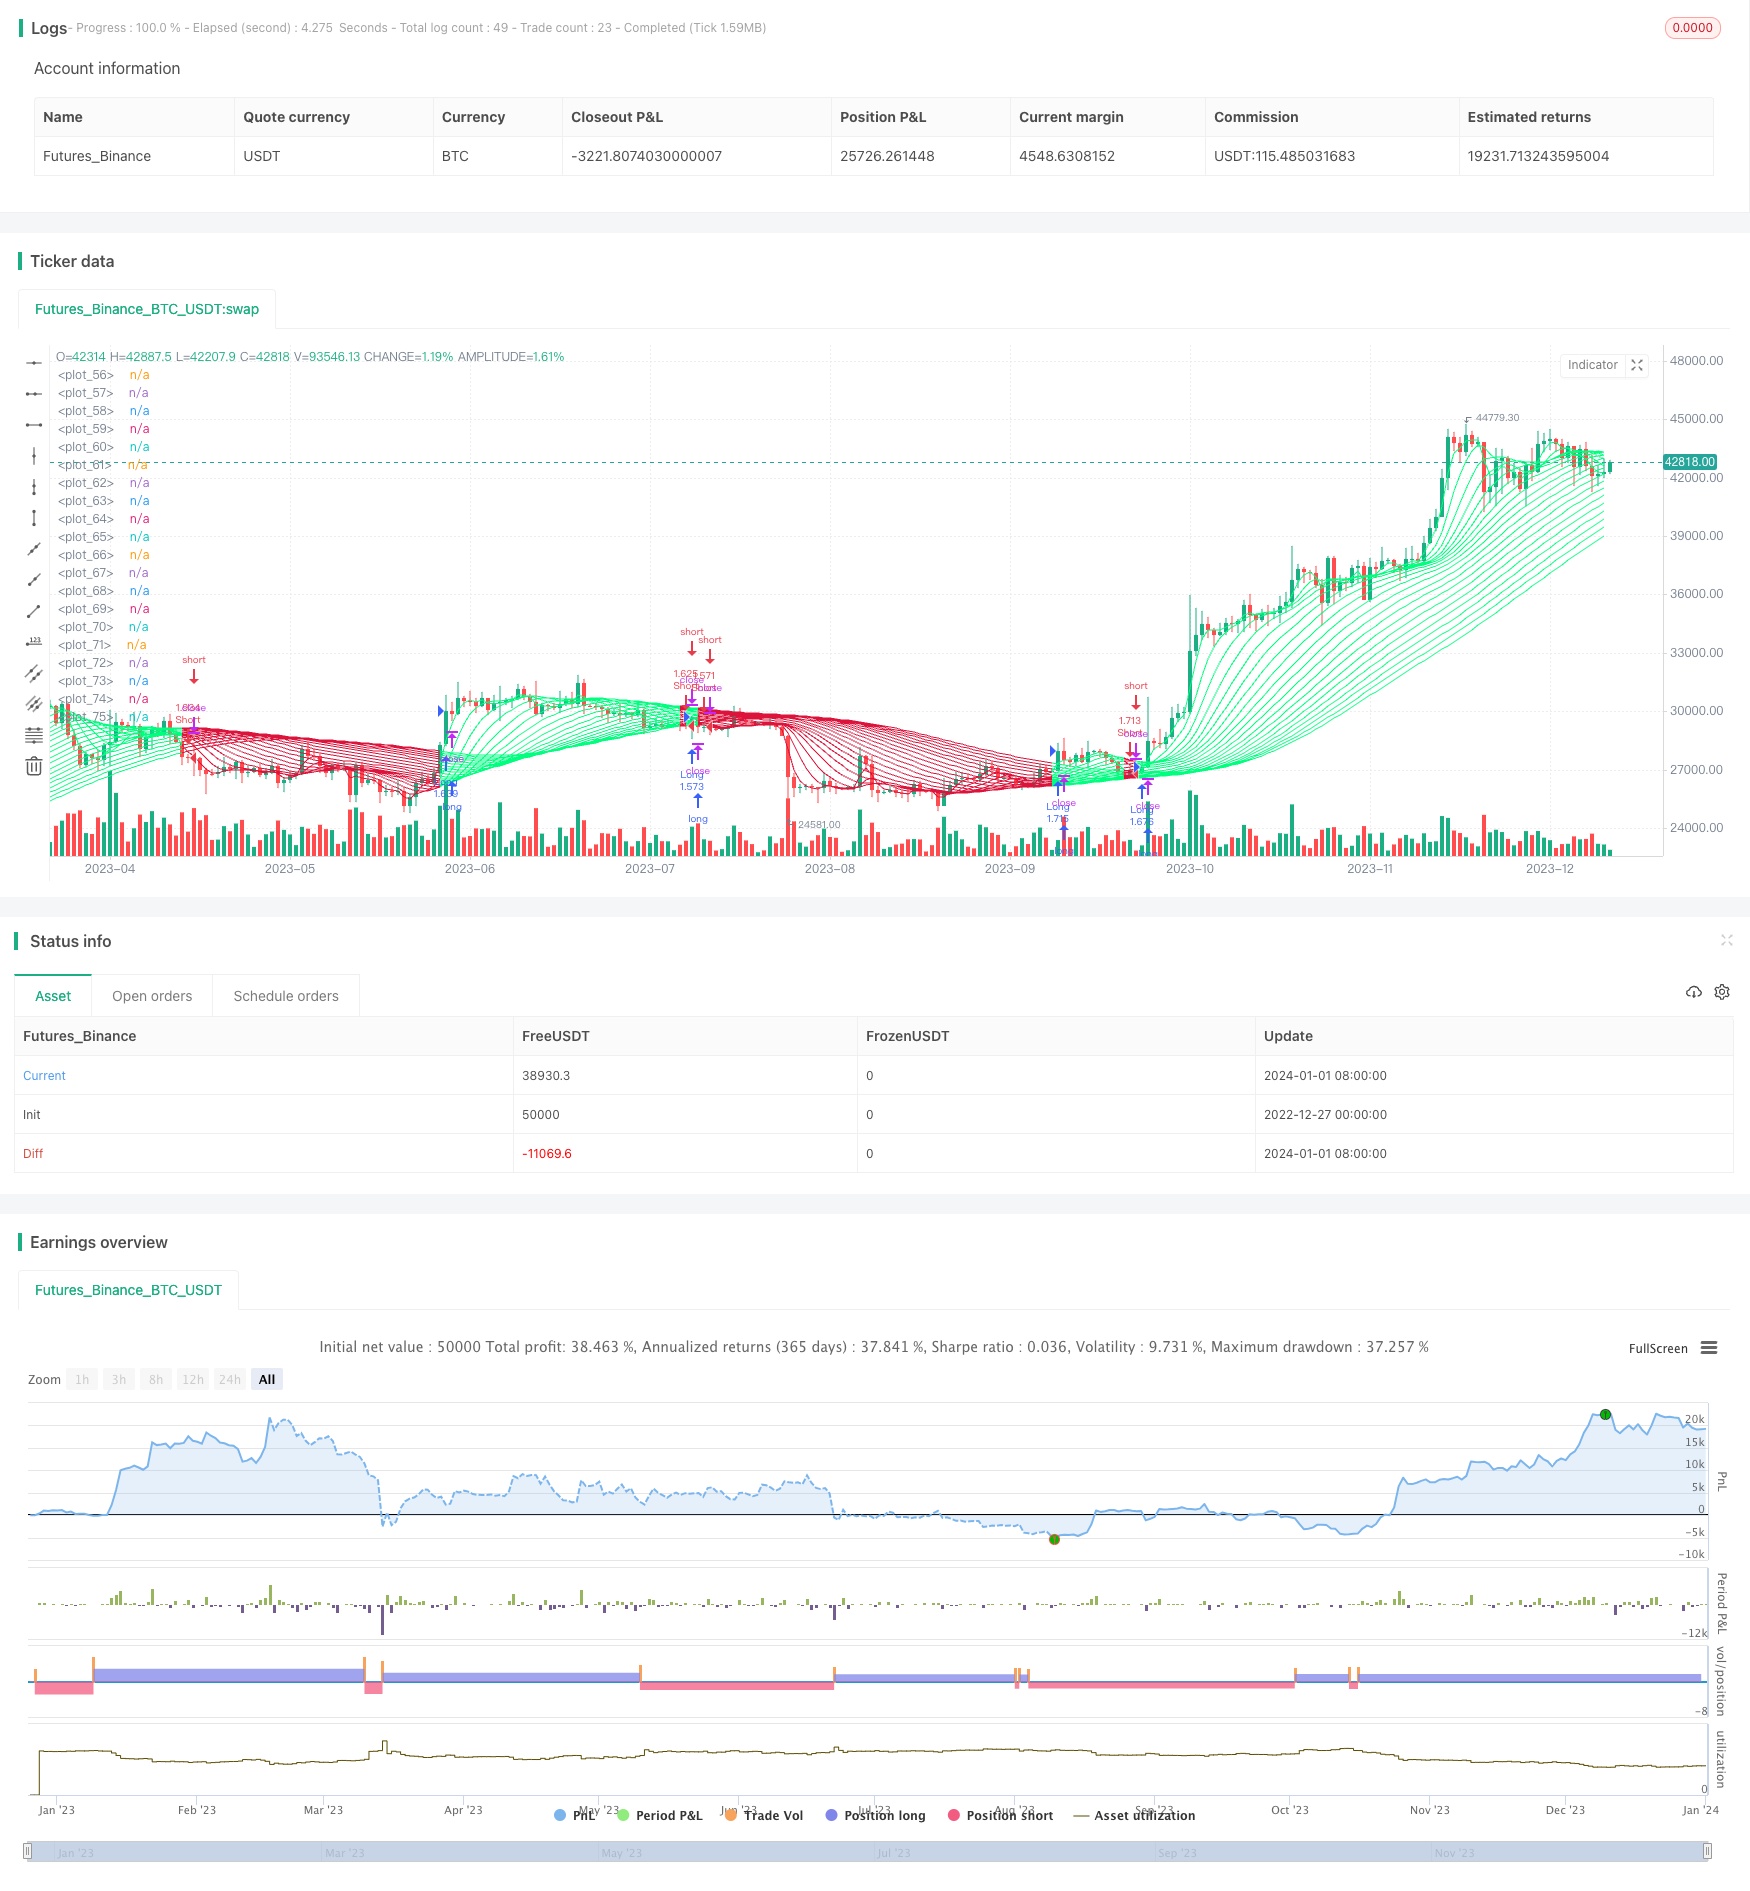
/*backtest
start: 2022-12-27 00:00:00
end: 2024-01-02 00:00:00
period: 1d
basePeriod: 1h
exchanges: [{"eid":"Futures_Binance","currency":"BTC_USDT"}]
*/

//Noro
//2019

//@version=3
strategy(title = "Noro's Fishnet Strategy", shorttitle = "Fishnet str", overlay = true, default_qty_type = strategy.percent_of_equity, default_qty_value = 100, pyramiding = 0)

//Settings
needlong = input(true, defval = true, title = "Long")
needshort = input(true, defval = true, title = "Short")
capital = input(100, defval = 100, minval = 1, maxval = 10000, title = "Lot")
usecf = input(false, defval = false, title = "Use Color-filter")
fromyear = input(1900, defval = 1900, minval = 1900, maxval = 2100, title = "From Year")
toyear = input(2100, defval = 2100, minval = 1900, maxval = 2100, title = "To Year")
frommonth = input(01, defval = 01, minval = 01, maxval = 12, title = "From Month")
tomonth = input(12, defval = 12, minval = 01, maxval = 12, title = "To Month")
fromday = input(01, defval = 01, minval = 01, maxval = 31, title = "From day")
today = input(31, defval = 31, minval = 01, maxval = 31, title = "To day")

//JMA
jmax(src, len) =>
    beta = 0.45*(len-1)/(0.45*(len-1)+2)
    alpha = pow(beta, 3)
    L0=0.0, L1=0.0, L2=0.0, L3=0.0, L4=0.0
    L0 := (1-alpha)*src + alpha*nz(L0[1])
    L1 := (src - L0[0])*(1-beta) + beta*nz(L1[1])
    L2 := L0[0] + L1[0]
    L3 := (L2[0] - nz(L4[1]))*((1-alpha)*(1-alpha)) + (alpha*alpha)*nz(L3[1])
    L4 := nz(L4[1]) + L3[0]
	L4

ma01 = jmax(close, 10)
ma02 = jmax(close, 20)
ma03 = jmax(close, 30)
ma04 = jmax(close, 40)
ma05 = jmax(close, 50)
ma06 = jmax(close, 60)
ma07 = jmax(close, 70)
ma08 = jmax(close, 80)
ma09 = jmax(close, 90)
ma10 = jmax(close, 100)
ma11 = jmax(close, 110)
ma12 = jmax(close, 120)
ma13 = jmax(close, 130)
ma14 = jmax(close, 140)
ma15 = jmax(close, 150)
ma16 = jmax(close, 160)
ma17 = jmax(close, 170)
ma18 = jmax(close, 180)
ma19 = jmax(close, 190)
ma20 = jmax(close, 200)

trend = 0
trend := ma01 > ma20 ? 1 : ma01 < ma20 ? -1 : trend[1]
col = trend == 1 ? #00FF7F : #DC143C

plot(ma01, transp = 0, color = col)
plot(ma02, transp = 0, color = col)
plot(ma03, transp = 0, color = col)
plot(ma04, transp = 0, color = col)
plot(ma05, transp = 0, color = col)
plot(ma06, transp = 0, color = col)
plot(ma07, transp = 0, color = col)
plot(ma08, transp = 0, color = col)
plot(ma09, transp = 0, color = col)
plot(ma10, transp = 0, color = col)
plot(ma11, transp = 0, color = col)
plot(ma12, transp = 0, color = col)
plot(ma13, transp = 0, color = col)
plot(ma14, transp = 0, color = col)
plot(ma15, transp = 0, color = col)
plot(ma16, transp = 0, color = col)
plot(ma17, transp = 0, color = col)
plot(ma18, transp = 0, color = col)
plot(ma19, transp = 0, color = col)
plot(ma20, transp = 0, color = col)

//Trading
lot = 0.0
lot := strategy.equity / close * capital / 100

if trend == 1 and (close < open or usecf == false)
    strategy.entry("Long", strategy.long, needlong ? lot : na)

if trend == -1 and (close > open or usecf == false)
    strategy.entry("Short", strategy.short, needshort ? lot : na)