概述
该策略采用价格动量指标来判断交易方向。具体而言,分别计算均线和均价,当价格上穿均线和均价时产生买入信号。为过滤假信号,要求之前没有类似信号。之后保存信号状态,并结合均线判断产生最终的开仓信号。策略同时包含止损和止盈设置。
策略原理
该策略主要基于价格动量指标来判断趋势方向。首先计算价格的均线和均价:
swmaClose = swma(close)
vwapClose = vwap(close)
其中,swma为运动平均线,vwap为成交量加权平均价。这二者都能反映价格平均水平。
然后比较价格与均值的大小关系,判断是否上穿均线和均价,从而判断是否属于看涨信号:
swmaLong = close > swmaClose
vwapLong = close > vwapClose
为过滤假信号,要求这两个指标之前没有给出信号:
triggerLong = vwapLong and not vwapLong[1] and not swmaLong and not swmaLong[1]
接下来保存看涨信号:
saveLong = false, saveLong := triggerLong ? true : not vwapLong ? false : saveLong[1]
最后,当保存了上穿信号,并且价格再度上穿均线时,产生开仓信号:
startLong = saveLong and swmaLong
这样可以过滤掉部分假信号,使得信号更加可靠。
策略还包含止损止盈设置。止损距离为可配置,止盈设置为止损的一定倍数。
优势分析
该策略具有以下优势:
- 使用价格动量指标,能较好判断趋势方向
- 结合双重指标和多步判断,可过滤假信号,使策略更可靠
- 止损止盈设置合理,可以控制单笔交易风险
- 策略参数可配置,适应不同市场环境
- 策略逻辑简单直接,容易理解实现
风险分析
该策略也存在一些风险:
- 均线指标存在滞后,可能错过部分价格波动
- 效果依赖参数设置,不同参数组合效果差异大
- 买点信号较少,存在一定漏单风险
- 多步判断会过滤部分机会,可能影响盈利水平
对策: 1. 可以测试不同均线参数,优化参数设置 2. 适当简化判断逻辑,增加买点信号 3. 调整止损止盈比例,控制单笔损失
优化方向
该策略还可以从以下方向进行优化:
- 测试更多价格动量指标,如MACD、DMI等
- 增加卖出信号判断,实现双向交易
- 结合交易量指标,避免潜在的假突破
- 根据回测结果优化参数设置
- 考虑根据市场环境自动调整参数
- 增加机器学习算法,实现参数自适应优化
这些优化可以提高策略灵活性、稳健性与盈利水平。
总结
该价格动量追踪策略整体来说是简单直接、逻辑清晰的趋势追踪策略。策略使用价格均线和均价判断价格动量方向,并设计多步验证机制来提高信号质量。策略同时包含合理的止损止盈设定。从代码量来看,策略逻辑非常简洁,只需要20多行pine脚本即可实现。总的来说,该策略是一个非常好的学习案例,初学者可以作为量化交易战略理解的很好的起点。当然,策略本身也具有实际的交易价值,通过参数优化和功能扩展,可以成为避免噪音、跟踪趋势的实用交易系统。
策略源码
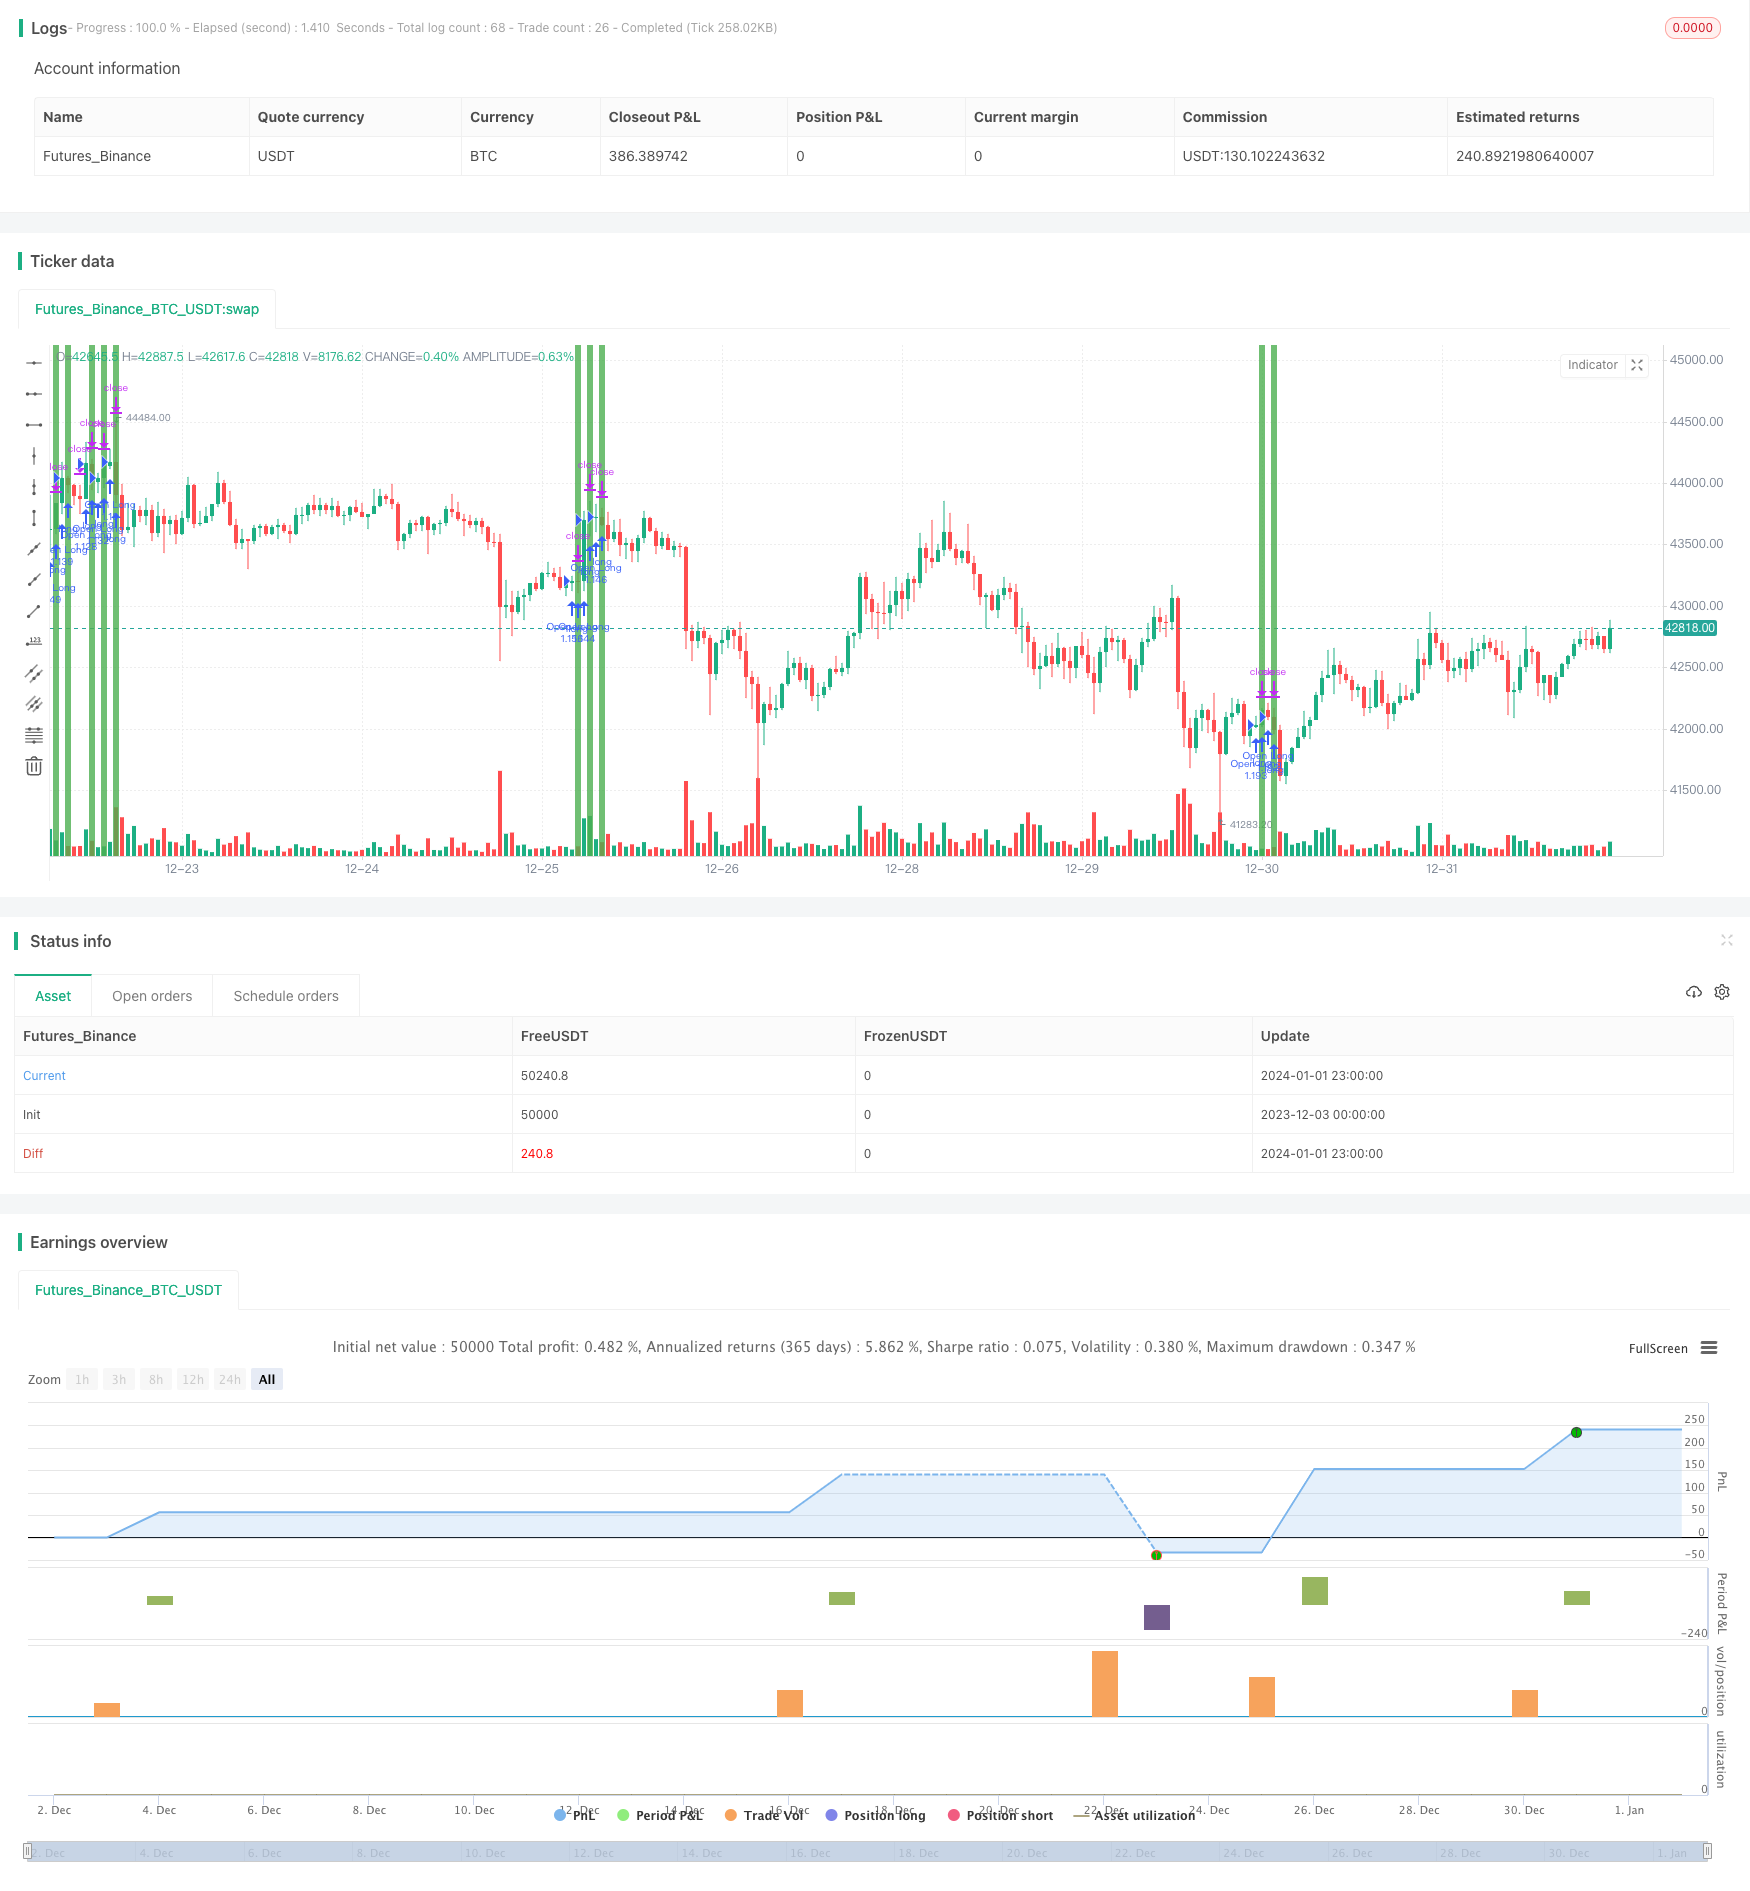
/*backtest
start: 2023-12-03 00:00:00
end: 2024-01-02 00:00:00
period: 1h
basePeriod: 15m
exchanges: [{"eid":"Futures_Binance","currency":"BTC_USDT"}]
*/

//@version=4
strategy(title = "Simple Price Momentum", shorttitle = "SPM", overlay = true, initial_capital = 20000, default_qty_value = 100, default_qty_type = strategy.percent_of_equity, commission_value = 0.025)

// How To Create A Simple Trading Strategy With TradingView
// https://docs.google.com/document/d/1fXxCtPuGgTXb-RuBJNbwlfgkeiLTK5060LfTrzRlr5k/view

swmaClose = swma(close)
vwapClose = vwap(close)

swmaLong = close > swmaClose
vwapLong = close > vwapClose

triggerLong = vwapLong and not vwapLong[1] and not swmaLong and not swmaLong[1]
saveLong = false, saveLong := triggerLong ? true : not vwapLong ? false : saveLong[1]

startLong = saveLong and swmaLong
startLong := input(false, "Consecutive Orders") ? startLong : startLong and not startLong[1]

stopLoss = input(250, "Stop Loss", step = 50)
takeProfit = input(10, "Reward/Risk") * stopLoss

strategy.entry("Open Long", strategy.long, when = startLong)
strategy.exit("Exit Long", "Open Long", profit = stopLoss, loss = takeProfit)

// bgcolor(swmaLong ? color.blue : na)
// bgcolor(vwapLong ? color.orange : na)
// bgcolor(triggerLong ? color.purple : na)
// bgcolor(saveLong ? color.yellow : na)
bgcolor(startLong[1] ? color.green : na)