RSI and SMA Crossover Strategy

Author: ChaoZhang, Date: 2024-01-04 14:33:24
Tags:

img

Overview

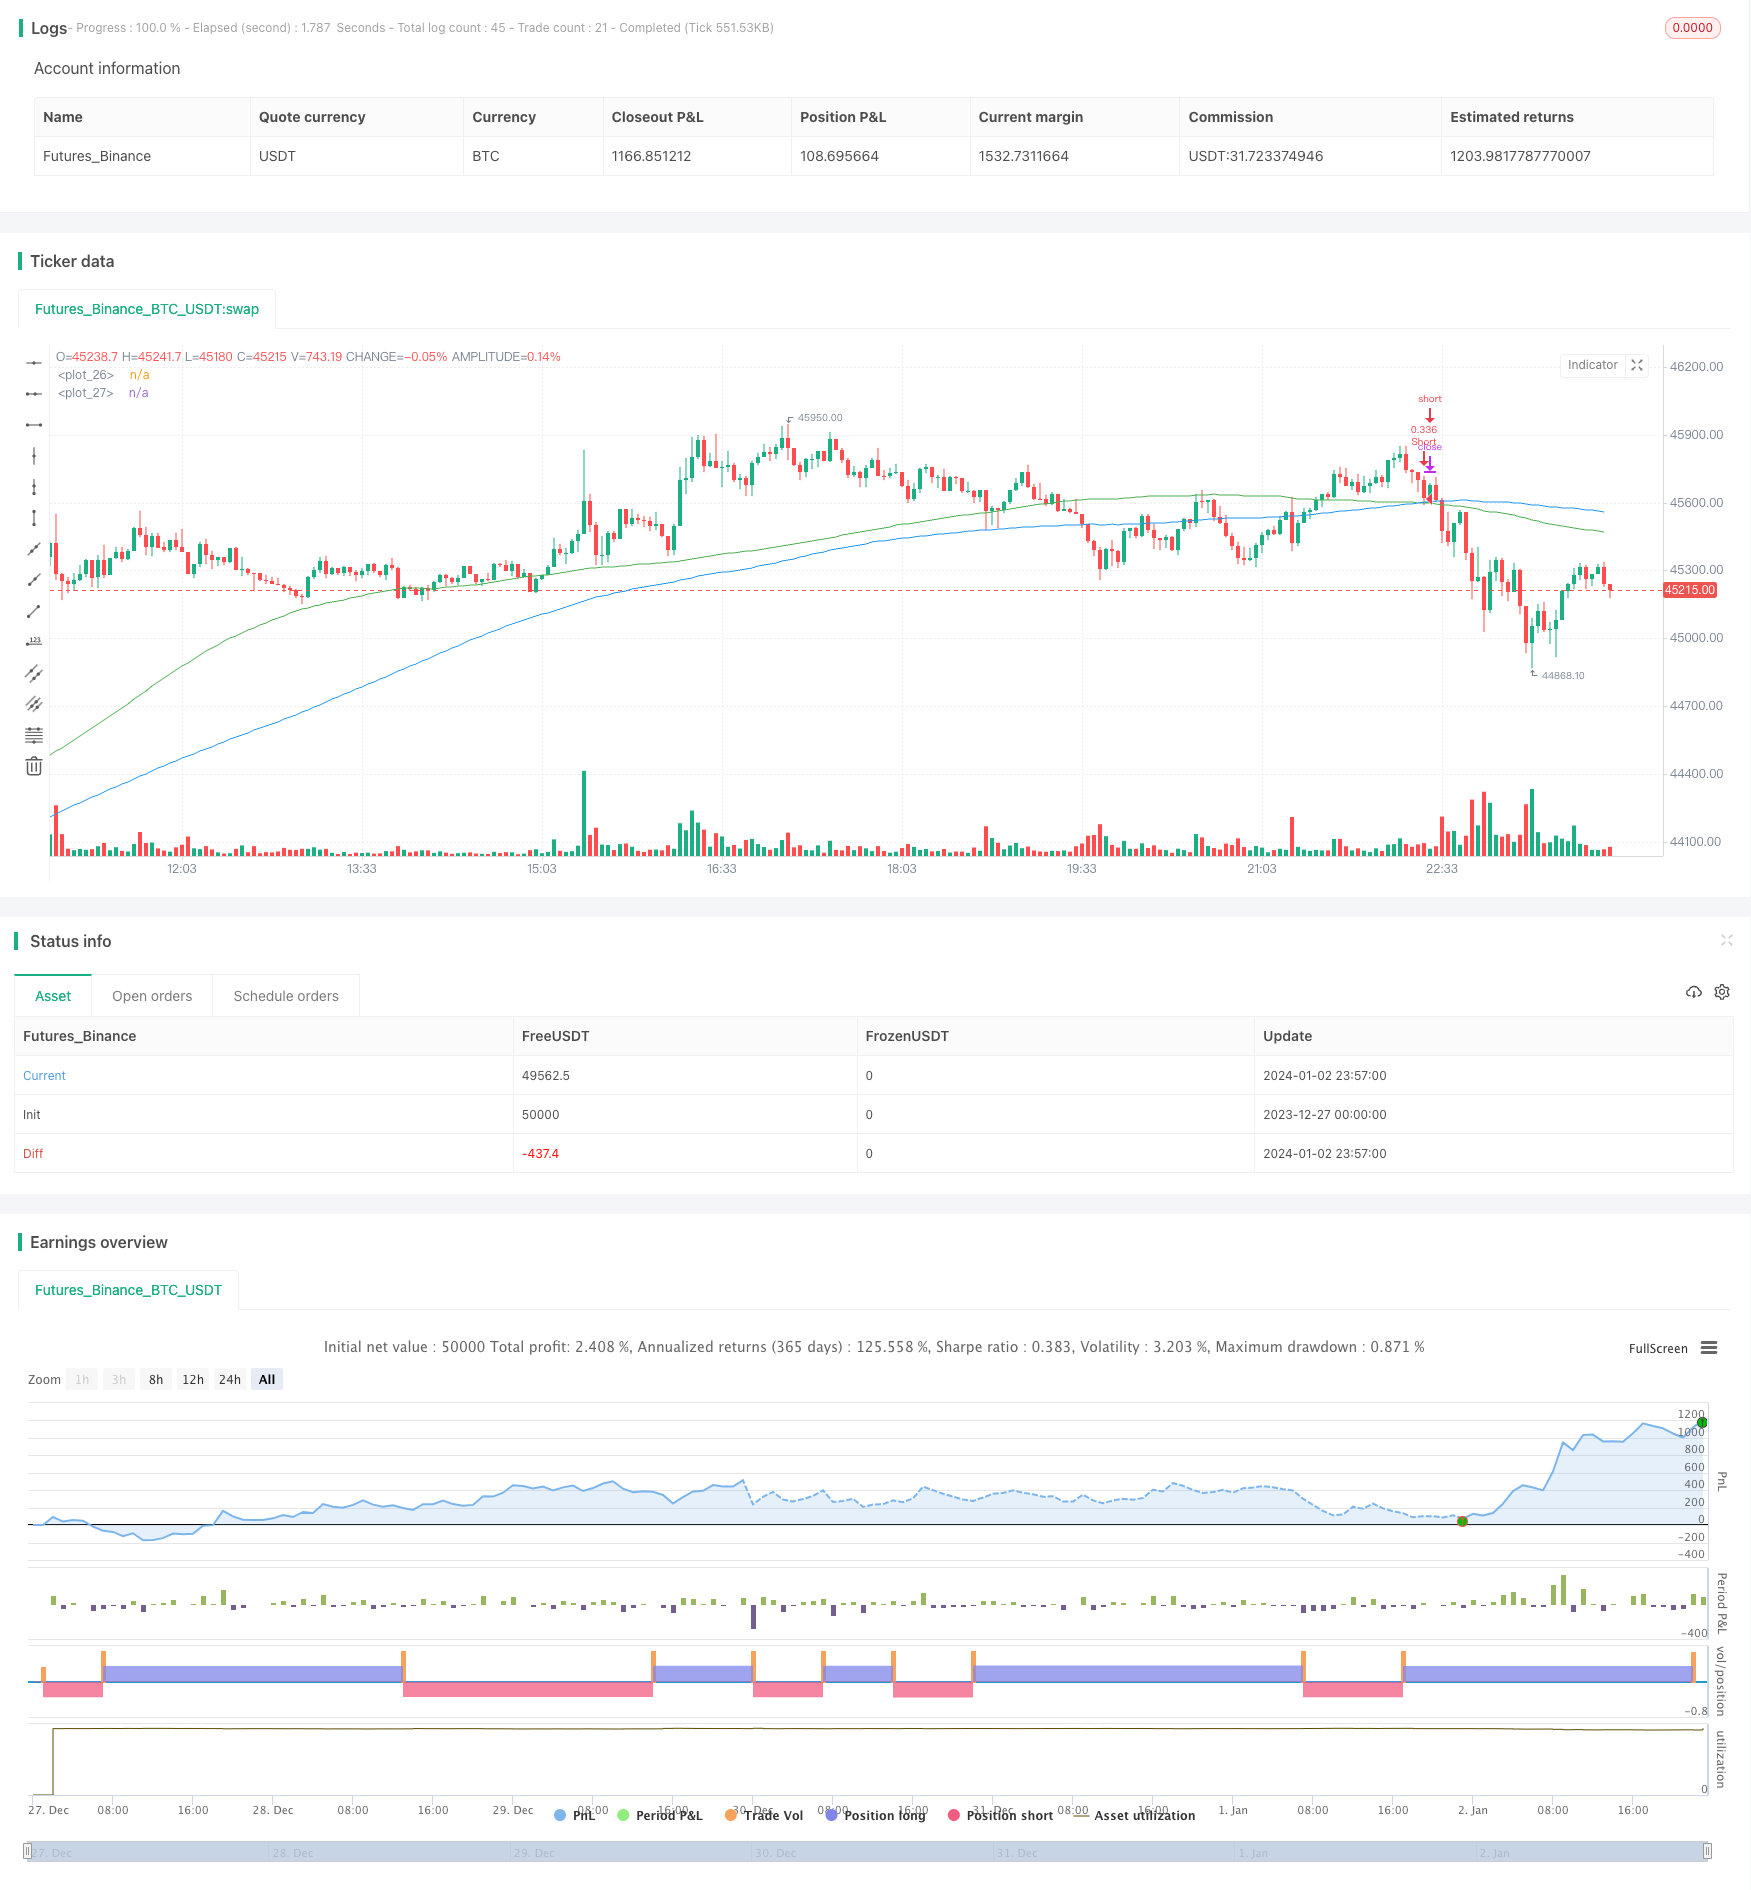
This strategy named “RSI and SMA Crossover Strategy”, its core idea is to use the RSI indicator to judge overbought and oversold conditions, and combine the golden cross and dead cross of SMA lines to generate trading signals. Go long when RSI is higher than 50 and short term SMA is higher than long term SMA, go short when RSI is lower than 50 and short term SMA is lower than long term SMA.

Strategy Principle

This strategy mainly combines the RSI indicator and the SMA moving average to form trading signals. The RSI indicator is used to judge the overbought and oversold conditions of security prices. RSI index higher than 50 indicates an overbought area, and lower than 50 indicates an oversold area. The golden cross and dead cross of SMA lines are also commonly used to determine buy and sell timing. This strategy combines the cross signals of the RSI indicator and SMA lines to form the basis for trading decisions.

Specifically, when the RSI indicator is higher than 50 (overbought area) and the short-term SMA crosses above the long-term SMA (golden cross), go long; when the RSI indicator is lower than 50 (oversold area) and the short-term SMA crosses below the long-term SMA (dead cross), go short. This utilizes both the RSI’s ability to judge overbought and oversold conditions, as well as the SMA lines’ golden cross and dead cross signals, so that combining the two can improve the accuracy of decisions.

Advantage Analysis

Compared with using the RSI indicator or SMA lines alone, the advantages of combining the two in this strategy include:

  1. It can more accurately judge the overbought and oversold conditions of prices. Looking at the SMA lines alone, the price may have already entered the overbought or oversold zone; looking at RSI alone cannot fully determine turns in price trends. Combining the two can form a more complete basis for judgments.

  2. It can filter out some noisy signals. Relying solely on the SMA lines’ golden crosses and dead crosses, some wrong signals may appear. Combining with the RSI indicator can filter out this noise.

  3. It can capture more trend opportunities. In the event of a clear trend in the market, relying solely on RSI may miss some opportunities, while combining SMA lines can continue to track and participate in bigger market moves.

In summary, the combination of RSI and SMA complements each other to form a more complete basis for trading decisions. It can capture trends while reducing incorrect signals, thus potentially yielding better backtesting metrics.

Risk Analysis

This strategy also has some potential risks to be aware of:

  1. Parameter setting risk. The periods for RSI and lengths of the SMA lines need to be set appropriately. Incorrect settings may lead to messy trading signals.

  2. Special market conditions risk. Under certain special market conditions, the indicators may fail, such as limit up/down of prices, price gaps after suspensions, etc. Signals may be incorrect in these cases.

  3. Drawdown risk. In the event of larger market pullbacks, the strategy account will also face drawdowns to some extent. This can be controlled by increasing position sizing management.

  4. Implementation difficulty risk. Though RSI and SMA lines are relatively simple, fine tuning the parameters and actual profitability requires certain skills and experience.

Optimization Directions

This strategy can also be optimized in the following aspects:

  1. Test optimal combination under different parameter settings. Try different period lengths for RSI and SMA to find the optimum.

  2. Add stop loss mechanisms, such as trailing stop loss, percentage based stops etc to lock in profits and control risk.

  3. Combine with other indicators to filter signals, such as MACD, Bollinger Bands etc to confirm trades and reduce errors.

  4. Differentiate parameters by product. Some products may need differentiated optimization of parameters for best results.

  5. Optimize position sizing schemes, such as iSkycan, volatility adjusted sizing etc.

Conclusion

This strategy makes decisions by combining the crossover signals of RSI and SMA, allowing judgement of overbought/oversold conditions while also capturing trend opportunities. Compared to single indicators, it has the advantage of more accurate judgements and noise filtering. At the same time, controlling drawdowns, optimizing parameter combinations and other risks need to be noted as well. With continuous optimization, better strategy performance can be obtained. In summary, this is a simple and practical strategy that demonstrates a typical quantitative trading strategy logic flow.


/*backtest
start: 2023-12-27 00:00:00
end: 2024-01-03 00:00:00
period: 3m
basePeriod: 1m
exchanges: [{"eid":"Futures_Binance","currency":"BTC_USDT"}]
*/

/// This source code is subject to the terms of the Mozilla Public License 2.0 at https://mozilla.org/MPL/2.0/
// © ExpertCryptoo1

//@version=5
strategy('RSI and SMA',
         overlay=true,
         initial_capital=1000,
         process_orders_on_close=true,
         default_qty_type=strategy.percent_of_equity,
         default_qty_value=30,
         commission_type=strategy.commission.percent,
         commission_value=0.1)

showDate = input(defval=true, title='Show Date Range')
timePeriod = time >= timestamp(syminfo.timezone, 2022, 1, 1, 0, 0)
notInTrade = strategy.position_size <= 0

//==================================Buy Conditions============================================
//RSI
length = input(14)
rsi = ta.rsi(close, length)

//SMA
fastEMA = ta.sma(close, 100)
slowEMA = ta.sma(close, 150)
plot(fastEMA, color = color.green)
plot(slowEMA, color = color.blue)


bullish = ta.crossover(fastEMA, slowEMA) and rsi > 50
bearish = ta.crossover(slowEMA, fastEMA) and rsi < 50

strategy.entry("Long", strategy.long, when=bullish and timePeriod)
strategy.close("Exit", when=bearish)

strategy.entry("Short", strategy.short, when=bearish and timePeriod)
strategy.close("Exit", when=bullish)


More