资源加载中... loading...

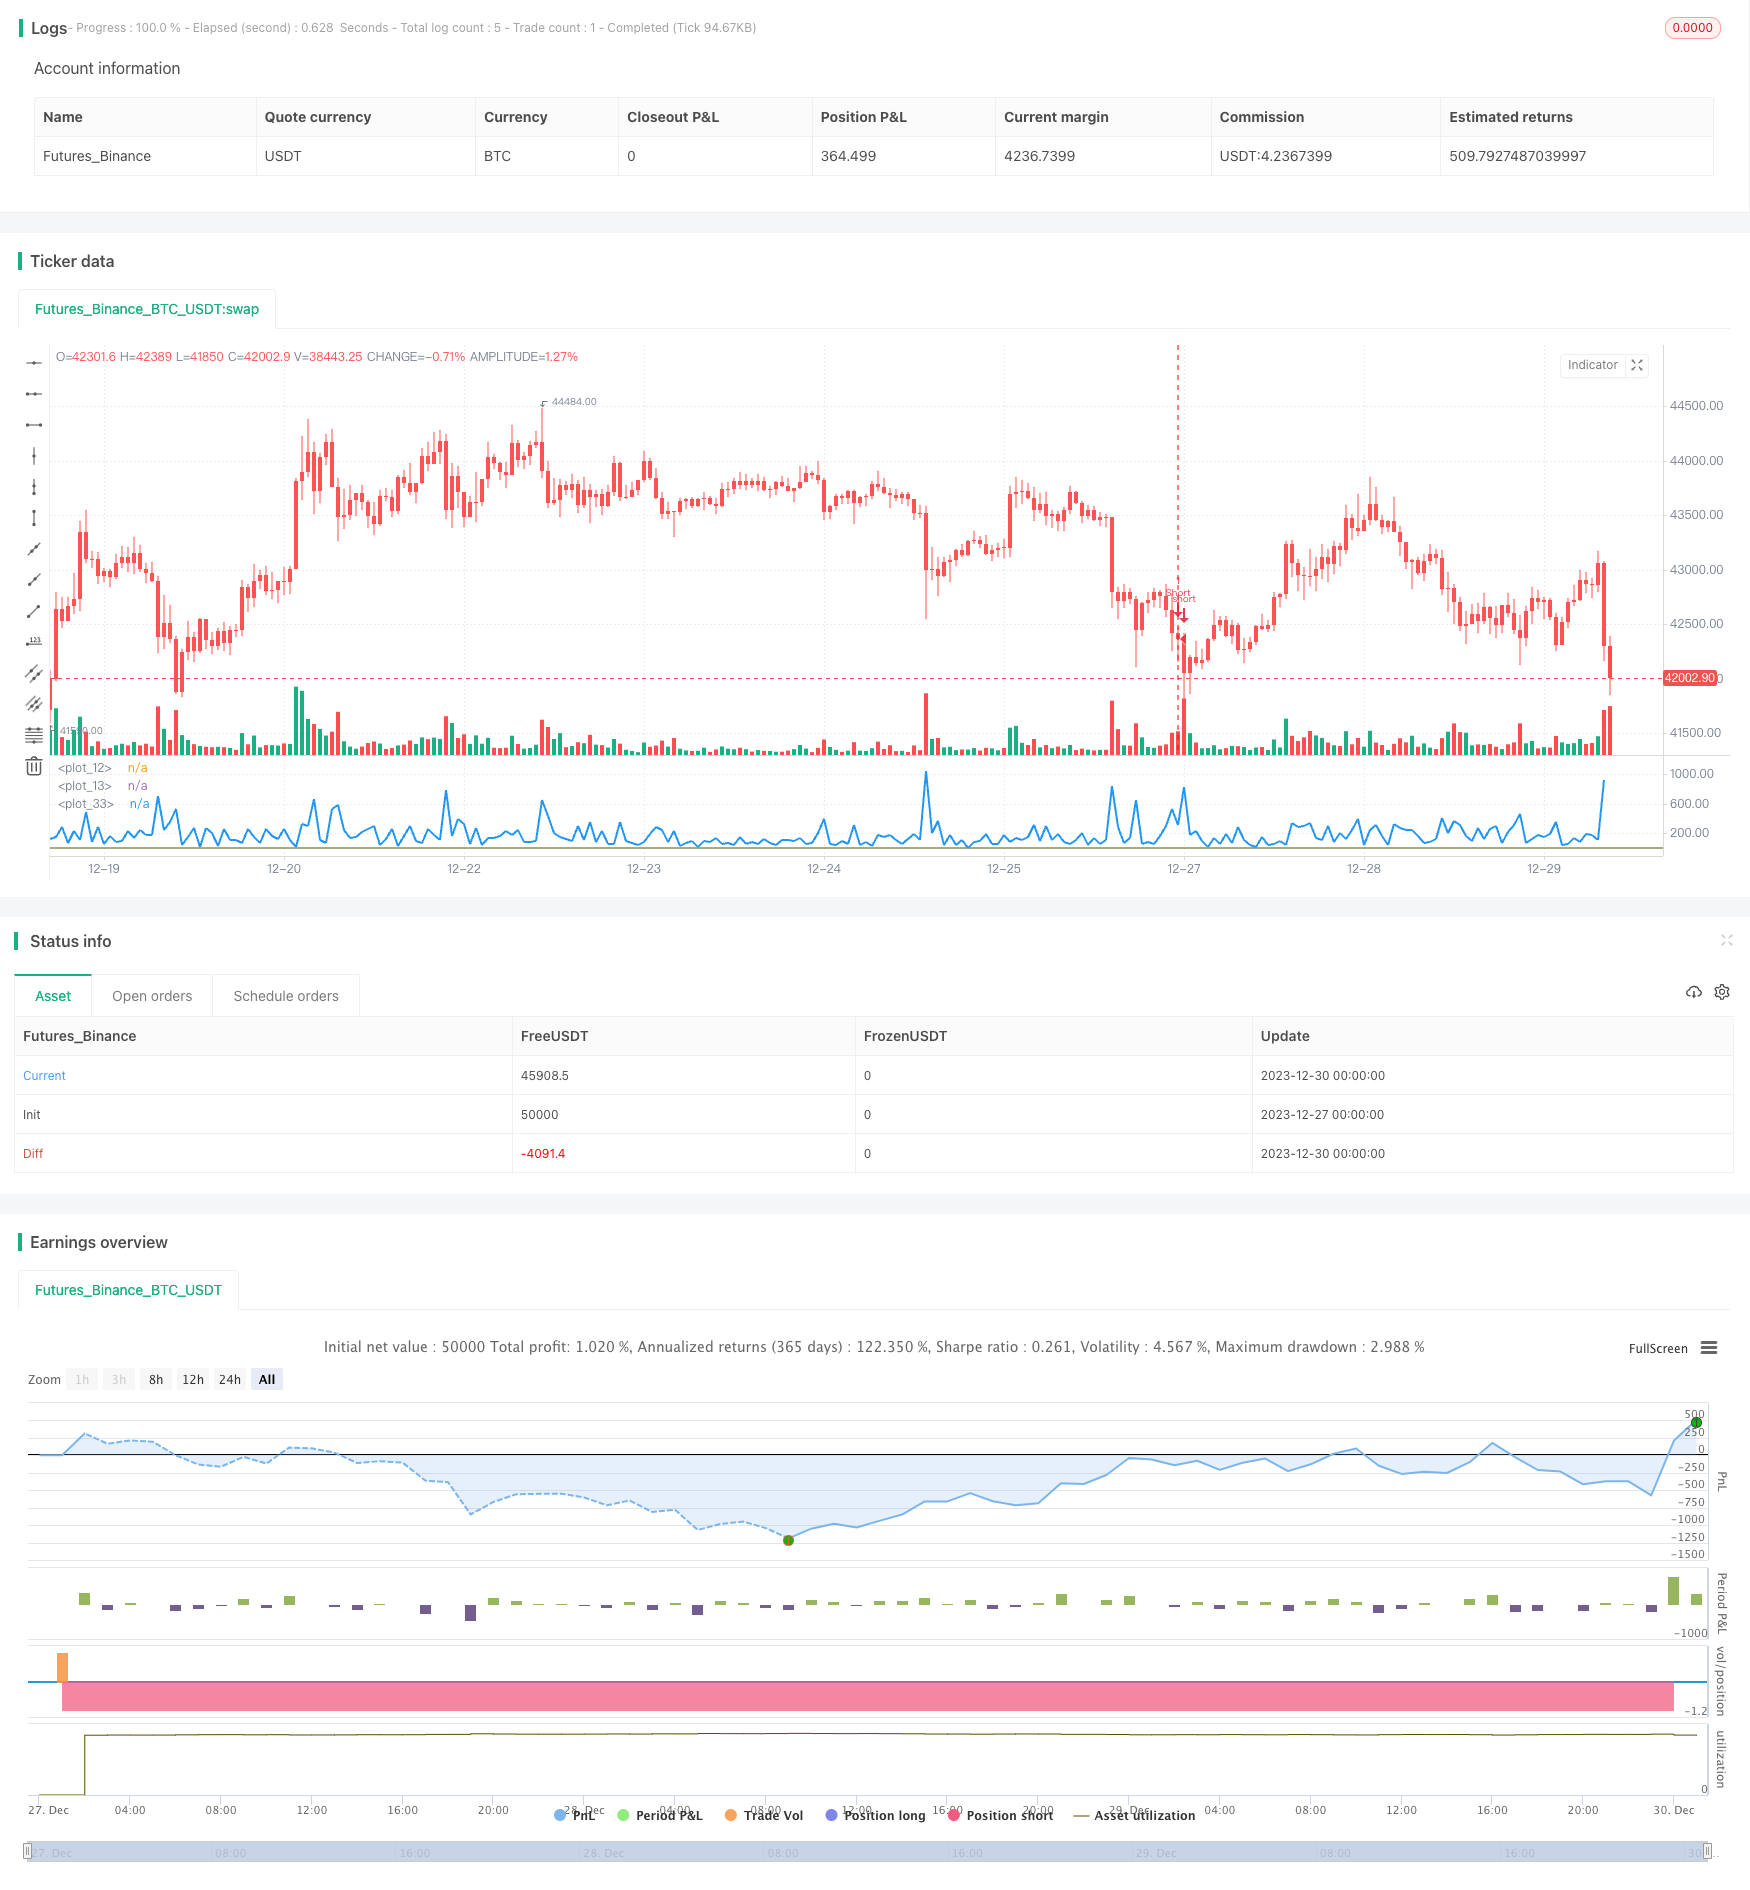
Bear Power Strategy

Author: ChaoZhang, Date: 2024-01-04 15:13:16
Tags:

img

Overview

The Bear Power strategy is a quantitative trading strategy based on the Bear Power indicator. This strategy generates trading signals by calculating the power of daily closing prices relative to opening prices to determine the current long/short status of the market. It goes short when the bear power exceeds a set sell level, and goes long when the bear power falls below a set buy level. This strategy is suitable for medium-term trading.

Strategy Principle

The core indicator of the Bear Power strategy is the Bear Power Indicator. This indicator calculates the long/short power of the market based on the difference between the closing price and the opening price. The specific calculation formula is as follows:

If Close < Open:
If Prev Close > Prev Open:
Bear Power = max(Close - Open, High - Low) Else: Bear Power = High - Low

If Close >= Open: If Prev Close > Prev Open: Bear Power = max(Prev Close - Low, High - Close) Else: Bear Power = max(Open - Low, High - Close)

The basic idea behind this formula is that if the closing price < the opening price today, it indicates a downward force in the market today, which is characteristic of a bear market; if the closing price >= the opening price, it indicates an upward force or consolidation in the market today, characteristic of a bull market. The formula contains previous day’s data to ensure continuity of power.

After calculating the Bear Power indicator, the strategy will set a sell line and a buy line. It goes short when the bear power crosses above the sell line, and goes long when the bear power crosses below the buy line.

Advantage Analysis

The Bear Power strategy has the following advantages:

  1. The source of the trading signals is unique and has some leading capability. The Bear Power indicator is rarely used in traditional technical analysis, providing a new perspective to judge market structure.

  2. The strategy has controllable drawdowns and some risk management functionality. Compared to strategies that aggressively track the market, the Bear Power strategy only issues trading orders when clear long/short signals appear in the market, which can effectively avoid unnecessary losses.

  3. The strategy has low implementation difficulty and is easy to apply in practice. It only relies on closing and opening prices to function, with uncomplicated logic.

  4. It can be flexibly optimized according to needs. For example, the buy/sell line positions can be adjusted for different markets, reverse trading logic can be added, etc.

Risk Analysis

The Bear Power strategy also has some risks:

  1. The market may stay range-bound for long periods, and the strategy will fail to capture huge profits generated by trends. In such cases, the strategy’s profit may mainly come from bid-ask spreads.

  2. The Bear Power Indicator is not 100% reliable for judgments, and its signals may fail. Other indicators are needed to verify its signals in such cases.

  3. The strategy relies solely on one or two indicators for signals, making it prone to overfitting. Single strategies tend to fail in actual trading. Multiple strategies should be combined for asset allocation and risk management.

  4. Trading costs and slippage are not considered in the strategy. In practical trading their impact is non-negligible and needs to be introduced in simulations.

Optimization Directions

The Bear Power strategy can be optimized in the following aspects:

  1. Add stop loss logic. Timely stop loss when market movements conflict signals can reduce losses.

  2. Add validation from other indicators. Combine indicators like moving averages and volatility to validate Bear Power signals and prevent failures.

  3. Introduce machine learning models. Use neural networks, SVM etc. to train the Bear Power indicator and establish more reliable long/short judgment models.

  4. Optimize buy/sell line positions. Find optimal parameter combinations via backtesting. Adaptive lines can also be used based on market profile.

  5. Add trend following mechanisms. Identify trending markets and switch to trend following strategies for higher profits.

Conclusion

The Bear Power strategy identifies market structures and profits from short positions in bear markets based on the unique Bear Power indicator. This strategy has controllable drawdowns and is easy to implement, suitable for medium-term trading. We can further optimize it in aspects like adding stops, signal verification, machine learning etc., to make it a robust quantitative strategy.


/*backtest
start: 2023-12-27 00:00:00
end: 2023-12-30 01:00:00
period: 1h
basePeriod: 15m
exchanges: [{"eid":"Futures_Binance","currency":"BTC_USDT"}]
*/

//@version=2
////////////////////////////////////////////////////////////
//  Copyright by HPotter v1.0 26/01/2017
//  Bear Power Indicator
//  To get more information please see "Bull And Bear Balance Indicator" 
//  by Vadim Gimelfarb. 
///////////////////////////////////////////////////////////
strategy(title = "Bear Power Strategy")
SellLevel = input(10, step=0.01)
BuyLevel = input(1, step=0.01)
reverse = input(false, title="Trade reverse")
hline(SellLevel, color=red, linestyle=line)
hline(BuyLevel, color=green, linestyle=line)
value =  iff (close < open ,  
             iff (close[1] > open ,  max(close - open, high - low), high - low), 
                 iff (close > open, 
                     iff(close[1] > open, max(close[1] - low, high - close), max(open - low, high - close)), 
                         iff(high - close > close - low, 
                             iff (close[1] > open, max(close[1] - open, high - low), high - low), 
                              iff (high - close < close - low, 
                               iff(close > open, max(close - low, high - close),open - low), 
                                 iff (close > open, max(close[1] - open, high - close),
                                  iff(close[1] < open, max(open - low, high - close), high - low))))))
pos = iff(value > SellLevel, -1,
	   iff(value <= BuyLevel, 1, nz(pos[1], 0))) 
possig = iff(reverse and pos == 1, -1,
          iff(reverse and pos == -1, 1, pos))
if (possig == -1) 
    strategy.entry("Short", strategy.short)
if (possig == 1)
    strategy.entry("Long", strategy.long)
barcolor(possig == -1 ? red: possig == 1 ? green : blue )
plot(value, style=line, linewidth=2, color=blue)
template: strategy.tpl:40:21: executing "strategy.tpl" at <.api.GetStrategyListByName>: wrong number of args for GetStrategyListByName: want 7 got 6