概述
量化追踪牛市策略是一个基于EMA均线和ATR止损的趋势追踪策略。它使用EMA均线判断大趋势方向,利用ATR动态跟踪止损来锁定趋势获利,实现盈利的最大化。
策略原理
该策略主要由以下几部分组成:
- EMA均线判断主趋势
使用13日线、50日线和100日线构成多空观点,判断主要趋势方向。
- ATR动态止损
利用ATR指标计算本周期内价格变动范围,来设定止损位,实现止盈止损。
- 信号平滑
对K线收盘价进行一定周期的SMA平滑,避免错信号。
- 多空信号
当价格上穿EMA均线时做多,下穿EMA均线时做空。并设置ATR动态跟踪止损。
优势分析
该策略具有以下优势:
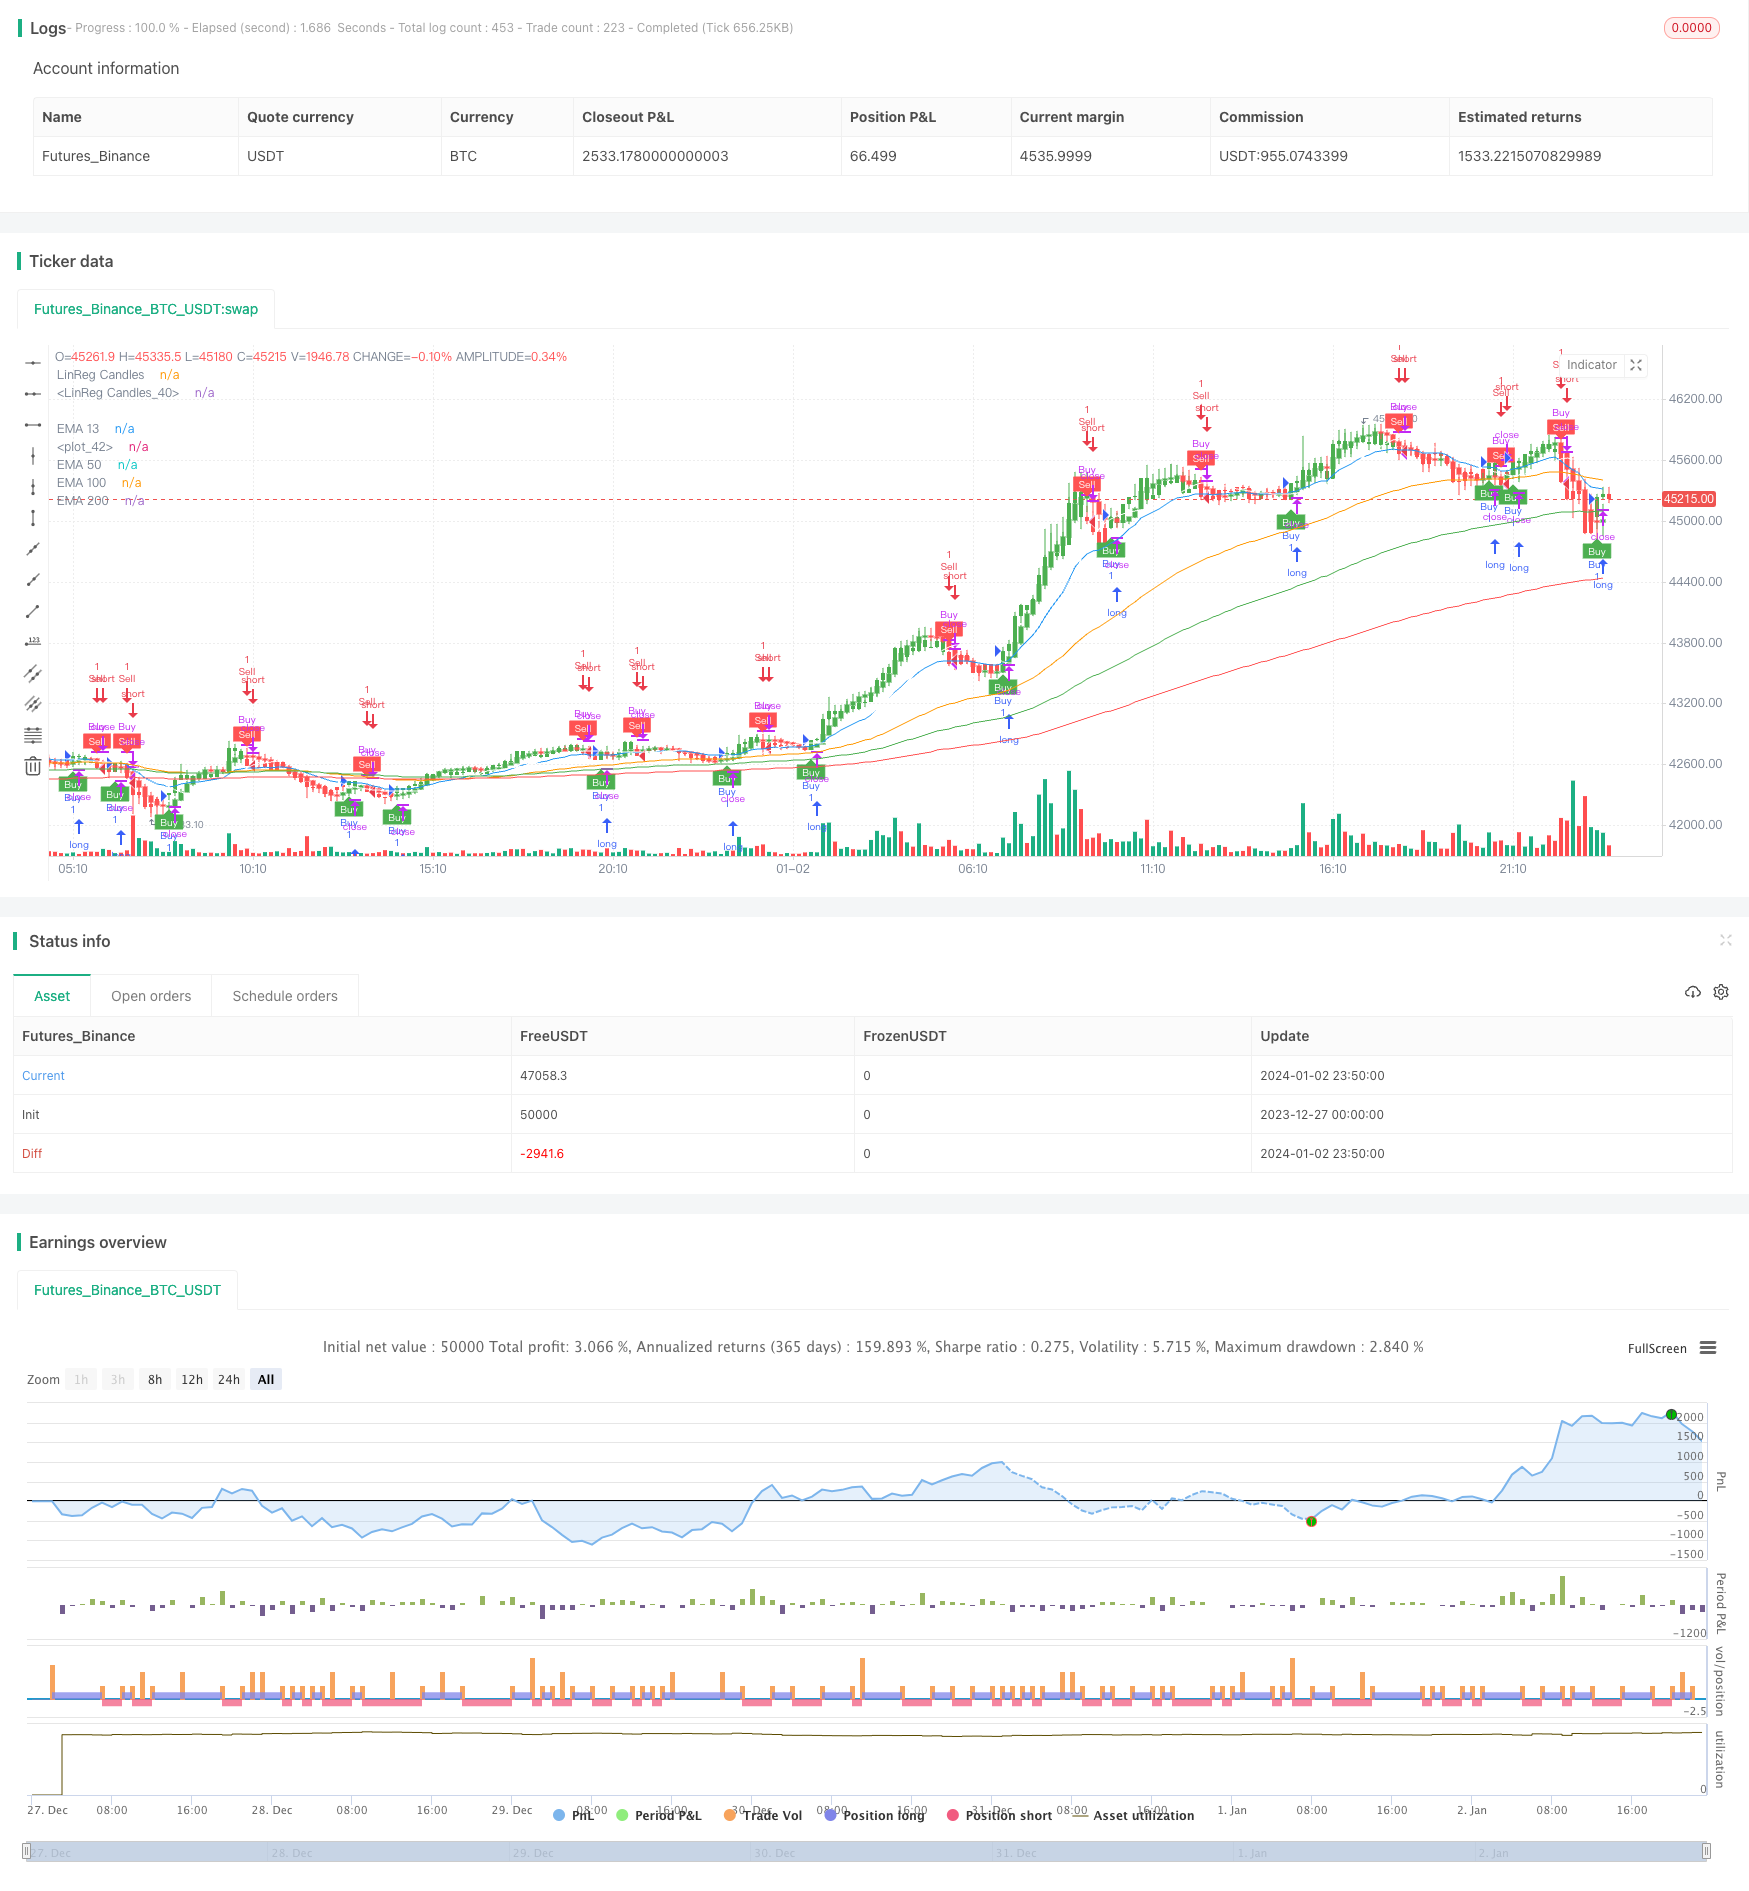
- 回撤控制优异,最大回撤可控制在160%以内。
- 跟踪止损比固定止损更智能,可锁定更多趋势获利。
- 利用EMA判断主要趋势方向,避免反转操作。
- 平滑K线,可过滤假信号,提高胜率。
风险分析
该策略也存在一定风险:
- 固定参数设置可能不适合不同品种,需要优化。
- 震荡行情中可能出现止损跳空。
- 需服务器稳定性支持,避免错过信号。
可以通过参数优化,适应性测试等手段来降低上述风险。
优化方向
该策略可从以下几个方向进行优化:
- 利用机器学习算法自动优化参数。
- 增加自适应止损机制,根据市场情况调整。
- 增加复合筛选条件,提高策略的稳定性。
- 考虑跨品种测试,提高策略的适应性。
总结
该策略总体来说是一个基于趋势追踪思路设计的量化策略。它利用EMA判断趋势方向,同时使用ATR进行智能止损。可有效控制回撤的同时获取趋势利润。通过持续优化迭代,可望获取较好的策略效果。
策略源码
/*backtest
start: 2023-12-27 00:00:00
end: 2024-01-03 00:00:00
period: 10m
basePeriod: 1m
exchanges: [{"eid":"Futures_Binance","currency":"BTC_USDT"}]
*/

//@version=4
strategy("Combined Strategy", overlay=true)

// Input variables for EMA Crossover
ema13_length = input(13, title="EMA 13 Length")
ema50_length = input(50, title="EMA 50 Length")
ema100_length = input(100, title="EMA 100 Length")
ema200_length = input(200, title="EMA 200 Length")

// Calculate EMAs for EMA Crossover
ema13 = ema(close, ema13_length)
ema50 = ema(close, ema50_length)
ema100 = ema(close, ema100_length)
ema200 = ema(close, ema200_length)

// Plot EMAs for EMA Crossover
plot(ema13, color=color.blue, title="EMA 13")
plot(ema50, color=color.orange, title="EMA 50")
plot(ema100, color=color.green, title="EMA 100")
plot(ema200, color=color.red, title="EMA 200")

// Input variables for LinReg Candles
signal_length = input(title="Signal Smoothing", type=input.integer, minval=1, maxval=200, defval=11)
sma_signal = input(title="Simple MA (Signal Line)", type=input.bool, defval=true)

lin_reg = input(title="Lin Reg", type=input.bool, defval=true)
linreg_length = input(title="Linear Regression Length", type=input.integer, minval=1, maxval=200, defval=11)

// Calculate LinReg Candles
bopen = lin_reg ? linreg(open, linreg_length, 0) : open
bhigh = lin_reg ? linreg(high, linreg_length, 0) : high
blow = lin_reg ? linreg(low, linreg_length, 0) : low
bclose = lin_reg ? linreg(close, linreg_length, 0) : close

r = bopen < bclose

signal = sma_signal ? sma(bclose, signal_length) : ema(bclose, signal_length)

plotcandle(r ? bopen : na, r ? bhigh : na, r ? blow: na, r ? bclose : na, title="LinReg Candles", color=color.green, wickcolor=color.green, bordercolor=color.green, editable=true)
plotcandle(r ? na : bopen, r ? na : bhigh, r ? na : blow, r ? na : bclose, title="LinReg Candles", color=color.red, wickcolor=color.red, bordercolor=color.red, editable=true)

plot(signal, color=color.white)

// Input variables for UT Bot Alerts
a = input(1, title="Key Value. 'This changes the sensitivity'")
c = input(10, title="ATR Period")
h = input(false, title="Signals from Heikin Ashi Candles")

// Calculate UT Bot Alerts
xATR = atr(c)
nLoss = a * xATR

src = h ? security(heikinashi(syminfo.tickerid), timeframe.period, close, lookahead=false) : close

xATRTrailingStop = 0.0
xATRTrailingStop := iff(src > nz(xATRTrailingStop[1], 0) and src[1] > nz(xATRTrailingStop[1], 0), max(nz(xATRTrailingStop[1]), src - nLoss),
   iff(src < nz(xATRTrailingStop[1], 0) and src[1] < nz(xATRTrailingStop[1], 0), min(nz(xATRTrailingStop[1]), src + nLoss),
   iff(src > nz(xATRTrailingStop[1], 0), src - nLoss, src + nLoss)))

pos = 0
pos := iff(src[1] < nz(xATRTrailingStop[1], 0) and src > nz(xATRTrailingStop[1], 0), 1,
   iff(src[1] > nz(xATRTrailingStop[1], 0) and src < nz(xATRTrailingStop[1], 0), -1, nz(pos[1], 0)))

xcolor = pos == -1 ? color.red: pos == 1 ? color.green : color.blue

ema = ema(src,1)
above = crossover(ema, xATRTrailingStop)
below = crossover(xATRTrailingStop, ema)

buy = src > xATRTrailingStop and above
sell = src < xATRTrailingStop and below

barbuy = src > xATRTrailingStop
barsell = src < xATRTrailingStop

strategy.entry("Buy", strategy.long, when=buy)
strategy.close("Buy", when=sell)
strategy.entry("Sell", strategy.short, when=sell)
strategy.close("Sell", when=buy)

plotshape(buy, title="Buy", text='Buy', style=shape.labelup, location=location.belowbar, color=color.green, textcolor=color.white, transp=0, size=size.tiny)
plotshape(sell, title="Sell", text='Sell', style=shape.labeldown, location=location.abovebar, color=color.red, textcolor=color.white, transp=0, size=size.tiny)

barcolor(barbuy ? color.green : na)
barcolor(barsell ? color.red : na)

alertcondition(buy, "UT Long", "UT Long")
alertcondition(sell, "UT Short", "UT Short")