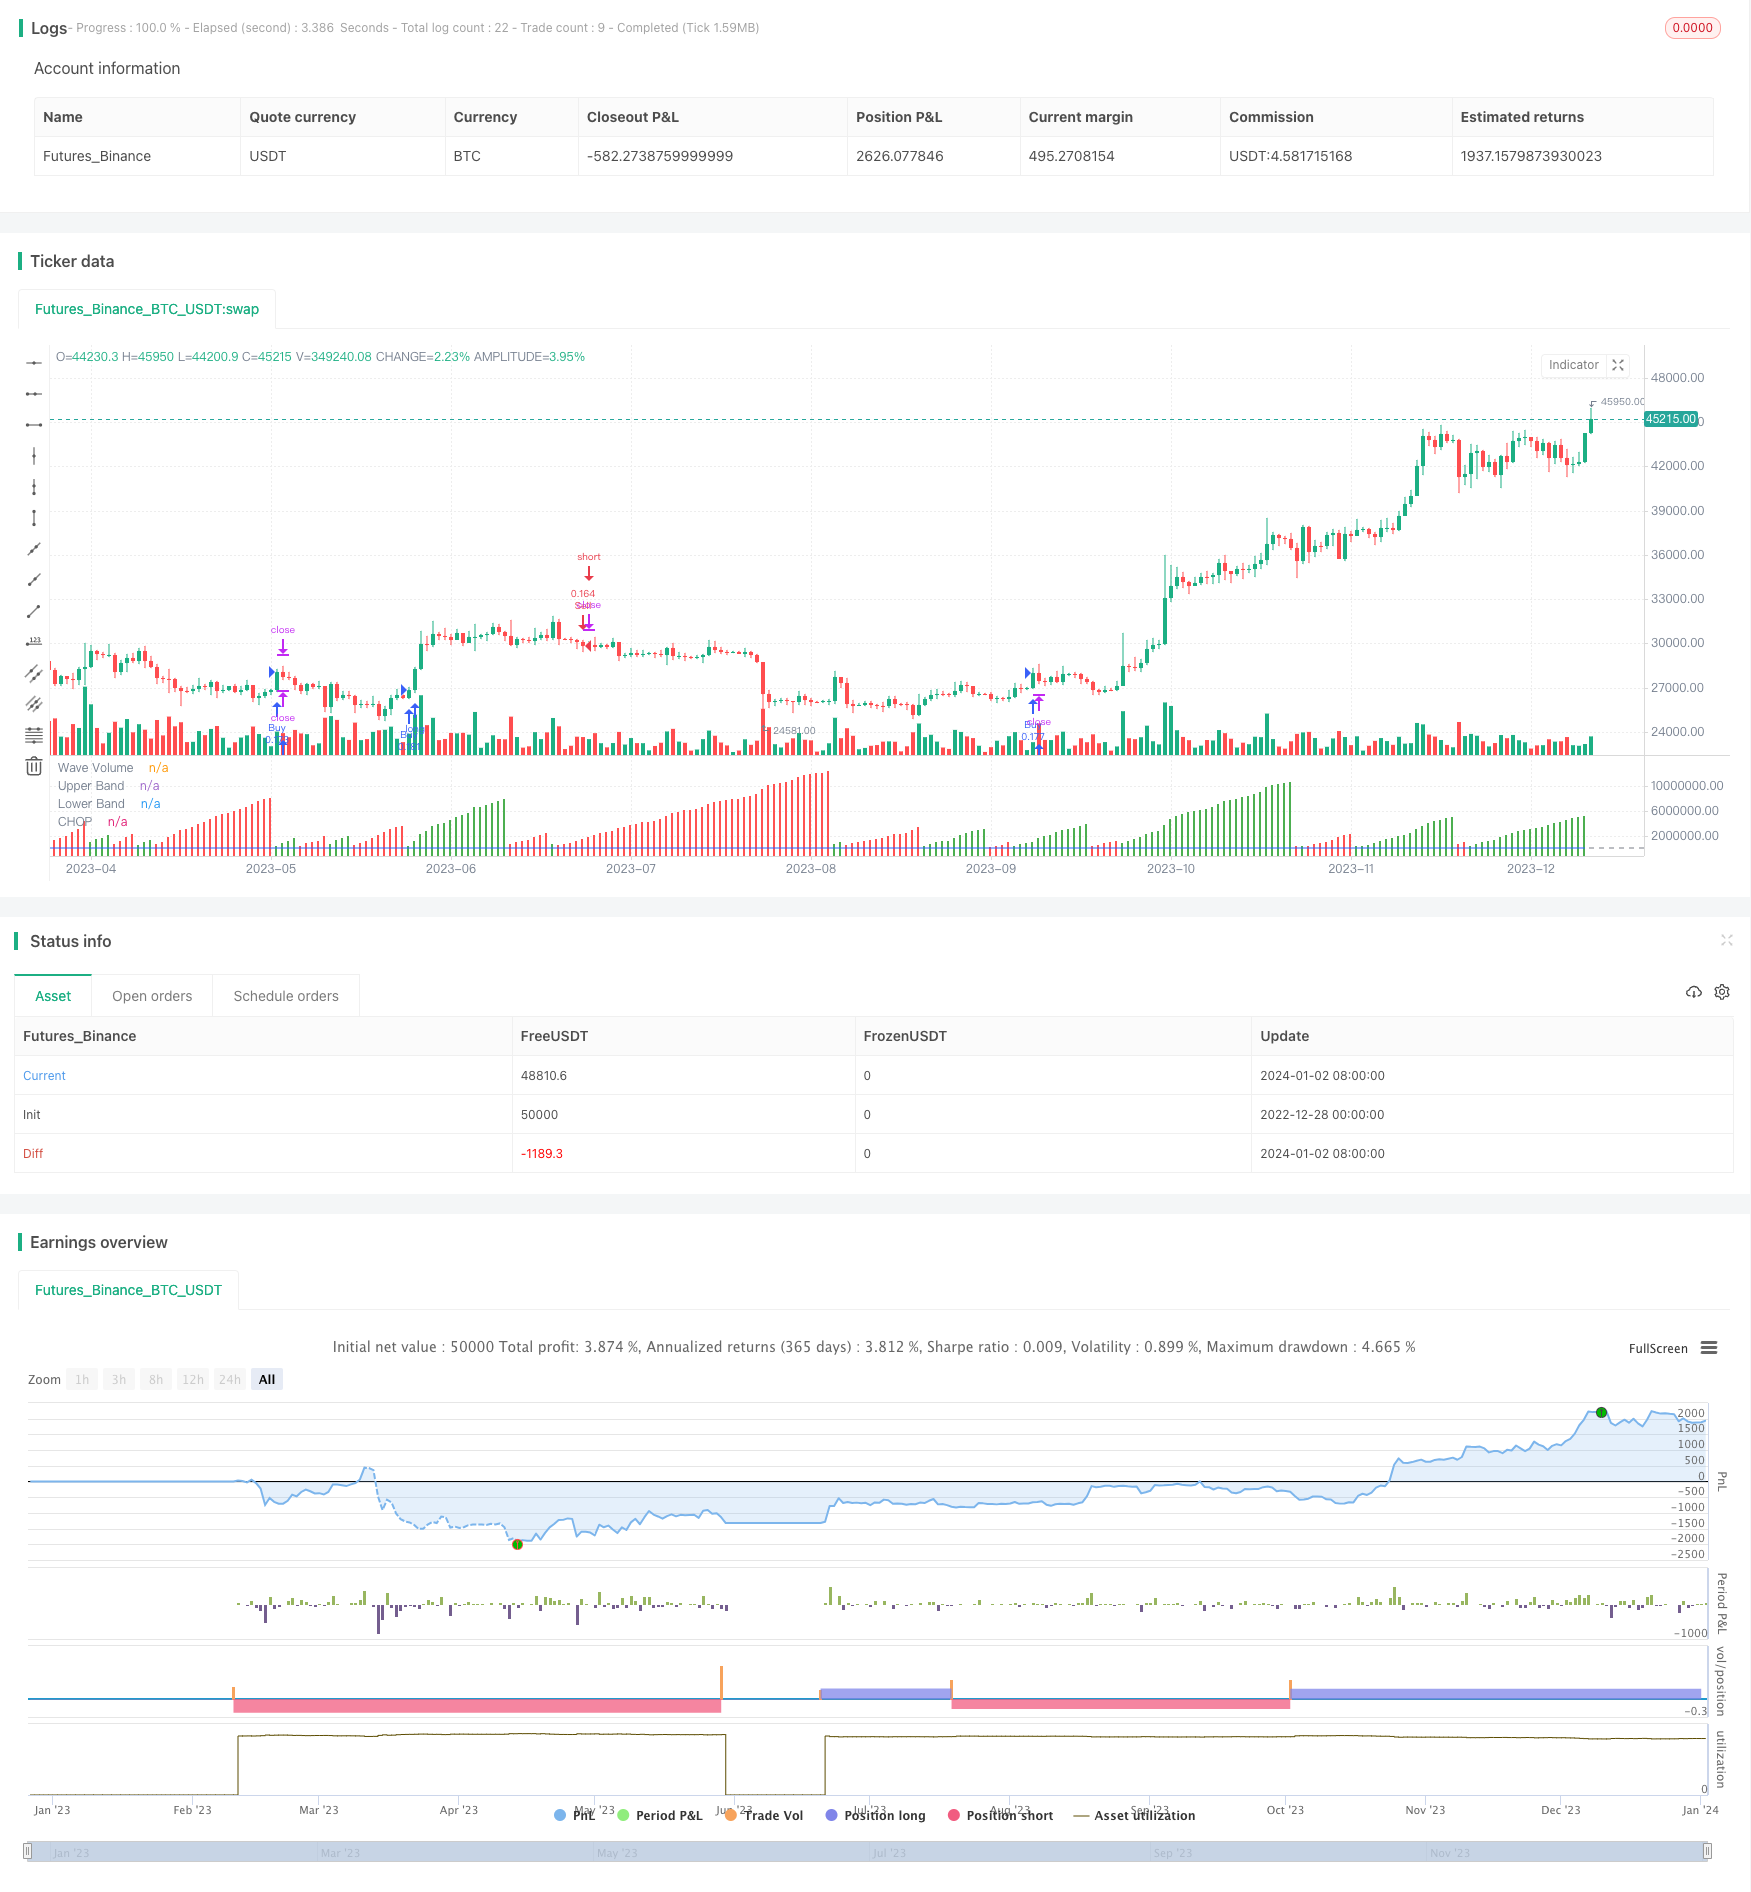
概述
该策略运用平均真实振幅(ATR)和波动性指数(CHOP)作为主要技术指标,实现对趋势的识别和跟踪。当指数突破上下轨时,结合趋势方向作为入场信号;当指数重新进入带状区域时,采取止损或止盈退出位置。
策略原理
- 使用ATR计算出箱体大小,构建瑞波克通道,判断价格趋势方向。
- 应用CHOP指标判断市场是否适合交易,该指标结合最高价、最低价和ATR,当其处于38.2-61.8区间时表示市场波动平缓;否则表示市场波动较大,不宜交易。
- 当CHOP指标从61.8的上轨向下突破时,价格进入下降趋势,如果短期快速EMA也显示价格领先,则做空;相反当CHOP从38.2的下轨向上突破并且短期EMA价格拉升时,做多。
- 使用止盈止损策略,当价格重新进入CHOP的38.2-61.8带状区域时止损或止盈。
策略优势分析
该策略结合趋势判断和波动性控制,既能捕捉价格趋势,又能控制风险,是一种相对稳定的趋势跟踪策略。
- 应用ATR构建的瑞波克通道,可以有效跟踪价格趋势。
- CHOP指标判断市场波动率,避免在剧烈波动中错误交易。
- 结合快速EMA判断短期趋势方向,避免反向操作。
- 止盈止损策略控制单笔损失。
风险分析
该策略主要面临的风险有:
- 在震荡行情中,ATR通道和CHOP指标可能产生错误信号。可适当调整参数以滤除错误信号。
- 单一技术指标组合无法完全避免亏损,需要人工干预确定大趋势。
- 止损位置设定过于宽松,单笔损失可能过大。应适当缩小止损幅度。
策略优化方向
该策略可从以下几个方面进行优化:
- 增加其他辅助指标判断信号,如K线形态、成交量等,提高信号准确率。
- 优化ATR和CHOP的参数,使其更好地捕捉价格波动。
- 设定动态止损止盈位置,让止盈空间更大,止损更快。
- 在大级别判断趋势后,适当放宽止损范围,以便在趋势中获得更大利润。
总结
该策略整合常用技术指标,简单实用。在参数调整优化下,可以获得不错的跟踪效果。但仍需人工判断大趋势,无法完全自动化。可作为辅助决策工具,也可供其他策略参考借鉴。
策略源码
/*backtest
start: 2022-12-28 00:00:00
end: 2024-01-03 00:00:00
period: 1d
basePeriod: 1h
exchanges: [{"eid":"Futures_Binance","currency":"BTC_USDT"}]
*/

// This source code is subject to the terms of the Mozilla Public License 2.0 at https://mozilla.org/MPL/2.0/
// © sharatgbhat

//@version=4
strategy("Weis Chop Strategy", overlay=false, default_qty_type = strategy.percent_of_equity, default_qty_value = 10,max_lines_count = 500, max_labels_count = 500)
maxIdLossPcnt = input(1, "Max Intraday Loss(%)", type=input.float)
// strategy.risk.max_intraday_loss(maxIdLossPcnt, strategy.percent_of_equity)

method = input(defval="ATR", options=["ATR", "Traditional", "Part of Price"], title="Renko Assignment Method")
methodvalue = input(defval=14.0, type=input.float, minval=0, title="Value")
pricesource = input(defval="Close", options=["Close", "Open / Close", "High / Low"], title="Price Source")
useClose = pricesource == "Close"
useOpenClose = pricesource == "Open / Close" or useClose
useTrueRange = input(defval="Auto", options=["Always", "Auto", "Never"], title="Use True Range instead of Volume")
isOscillating = input(defval=false, type=input.bool, title="Oscillating")
normalize = input(defval=false, type=input.bool, title="Normalize")
vol = useTrueRange == "Always" or useTrueRange == "Auto" and na(volume) ? tr : volume
op = useClose ? close : open
hi = useOpenClose ? close >= op ? close : op : high
lo = useOpenClose ? close <= op ? close : op : low

if method == "ATR"
    methodvalue := atr(round(methodvalue))
if method == "Part of Price"
    methodvalue := close / methodvalue

currclose = float(na)
prevclose = nz(currclose[1])
prevhigh = prevclose + methodvalue
prevlow = prevclose - methodvalue
currclose := hi > prevhigh ? hi : lo < prevlow ? lo : prevclose

direction = int(na)
direction := currclose > prevclose ? 1 : currclose < prevclose ? -1 : nz(direction[1])
directionHasChanged = change(direction) != 0
directionIsUp = direction > 0
directionIsDown = direction < 0

barcount = 1
barcount := not directionHasChanged and normalize ? barcount[1] + barcount : barcount
vol := not directionHasChanged ? vol[1] + vol : vol
res = barcount > 1 ? vol / barcount : vol

plot(isOscillating and directionIsDown ? -res : res, style=plot.style_columns, color=directionIsUp ? color.green : color.red, transp=75, linewidth=3, title="Wave Volume")

length = input(14, minval=1)
ci = 100 * log10(sum(atr(1), length) / (highest(length) - lowest(length))) / log10(length)
offset = input(0, "Offset", type = input.integer, minval = -500, maxval = 500)
plot(ci, "CHOP", color=#2962FF, offset = offset)
band1 = hline(61.8, "Upper Band", color=#787B86, linestyle=hline.style_dashed)
band0 = hline(38.2, "Lower Band", color=#787B86, linestyle=hline.style_dashed)
fill(band1, band0, color = color.rgb(33, 150, 243, 90), title = "Background")

MomentumBull = close>ema(close,8)
MomentumBear = close<ema(close,8)
Tradecon = crossunder(ci,61.8)

if (MomentumBull and directionIsUp and Tradecon)
	strategy.entry("Buy", strategy.long)
if (MomentumBear and directionIsDown and Tradecon )
    strategy.entry("Sell", strategy.short)
    strategy.exit("exit","Buy",when=directionIsDown,qty_percent=100,profit=20,loss=10)
    strategy.exit("exit","Sell",when=directionIsUp,qty_percent=100,profit=20,loss=10)