概述
量能驱动策略通过分析交易量的变化,判断市场参与者情绪的多空变化。它将交易量划分为多头交易量和空头交易量,计算它们的加权移动平均值,当多头交易量占优时产生多头信号,空头交易量占优时产生空头信号。
策略原理
该策略首先根据收盘价和开盘价的关系,将每根K线的交易量划分为多头交易量和空头交易量。如果收盘价大于开盘价,那么整根K线的交易量就是多头交易量;如果收盘价小于开盘价,那么按照(最高价-开盘价)/(最高价-最低价)的比例计算该根K线的多头交易量,剩余的就是空头交易量。
然后分别计算最后n根K线的多头交易量和空头交易量的加权移动平均线。如果多头交易量的移动平均线大于空头交易量的移动平均线,并且两者之差占多头交易量的比例大于预设门槛,那么产生多头信号。空头信号的产生规则类似。
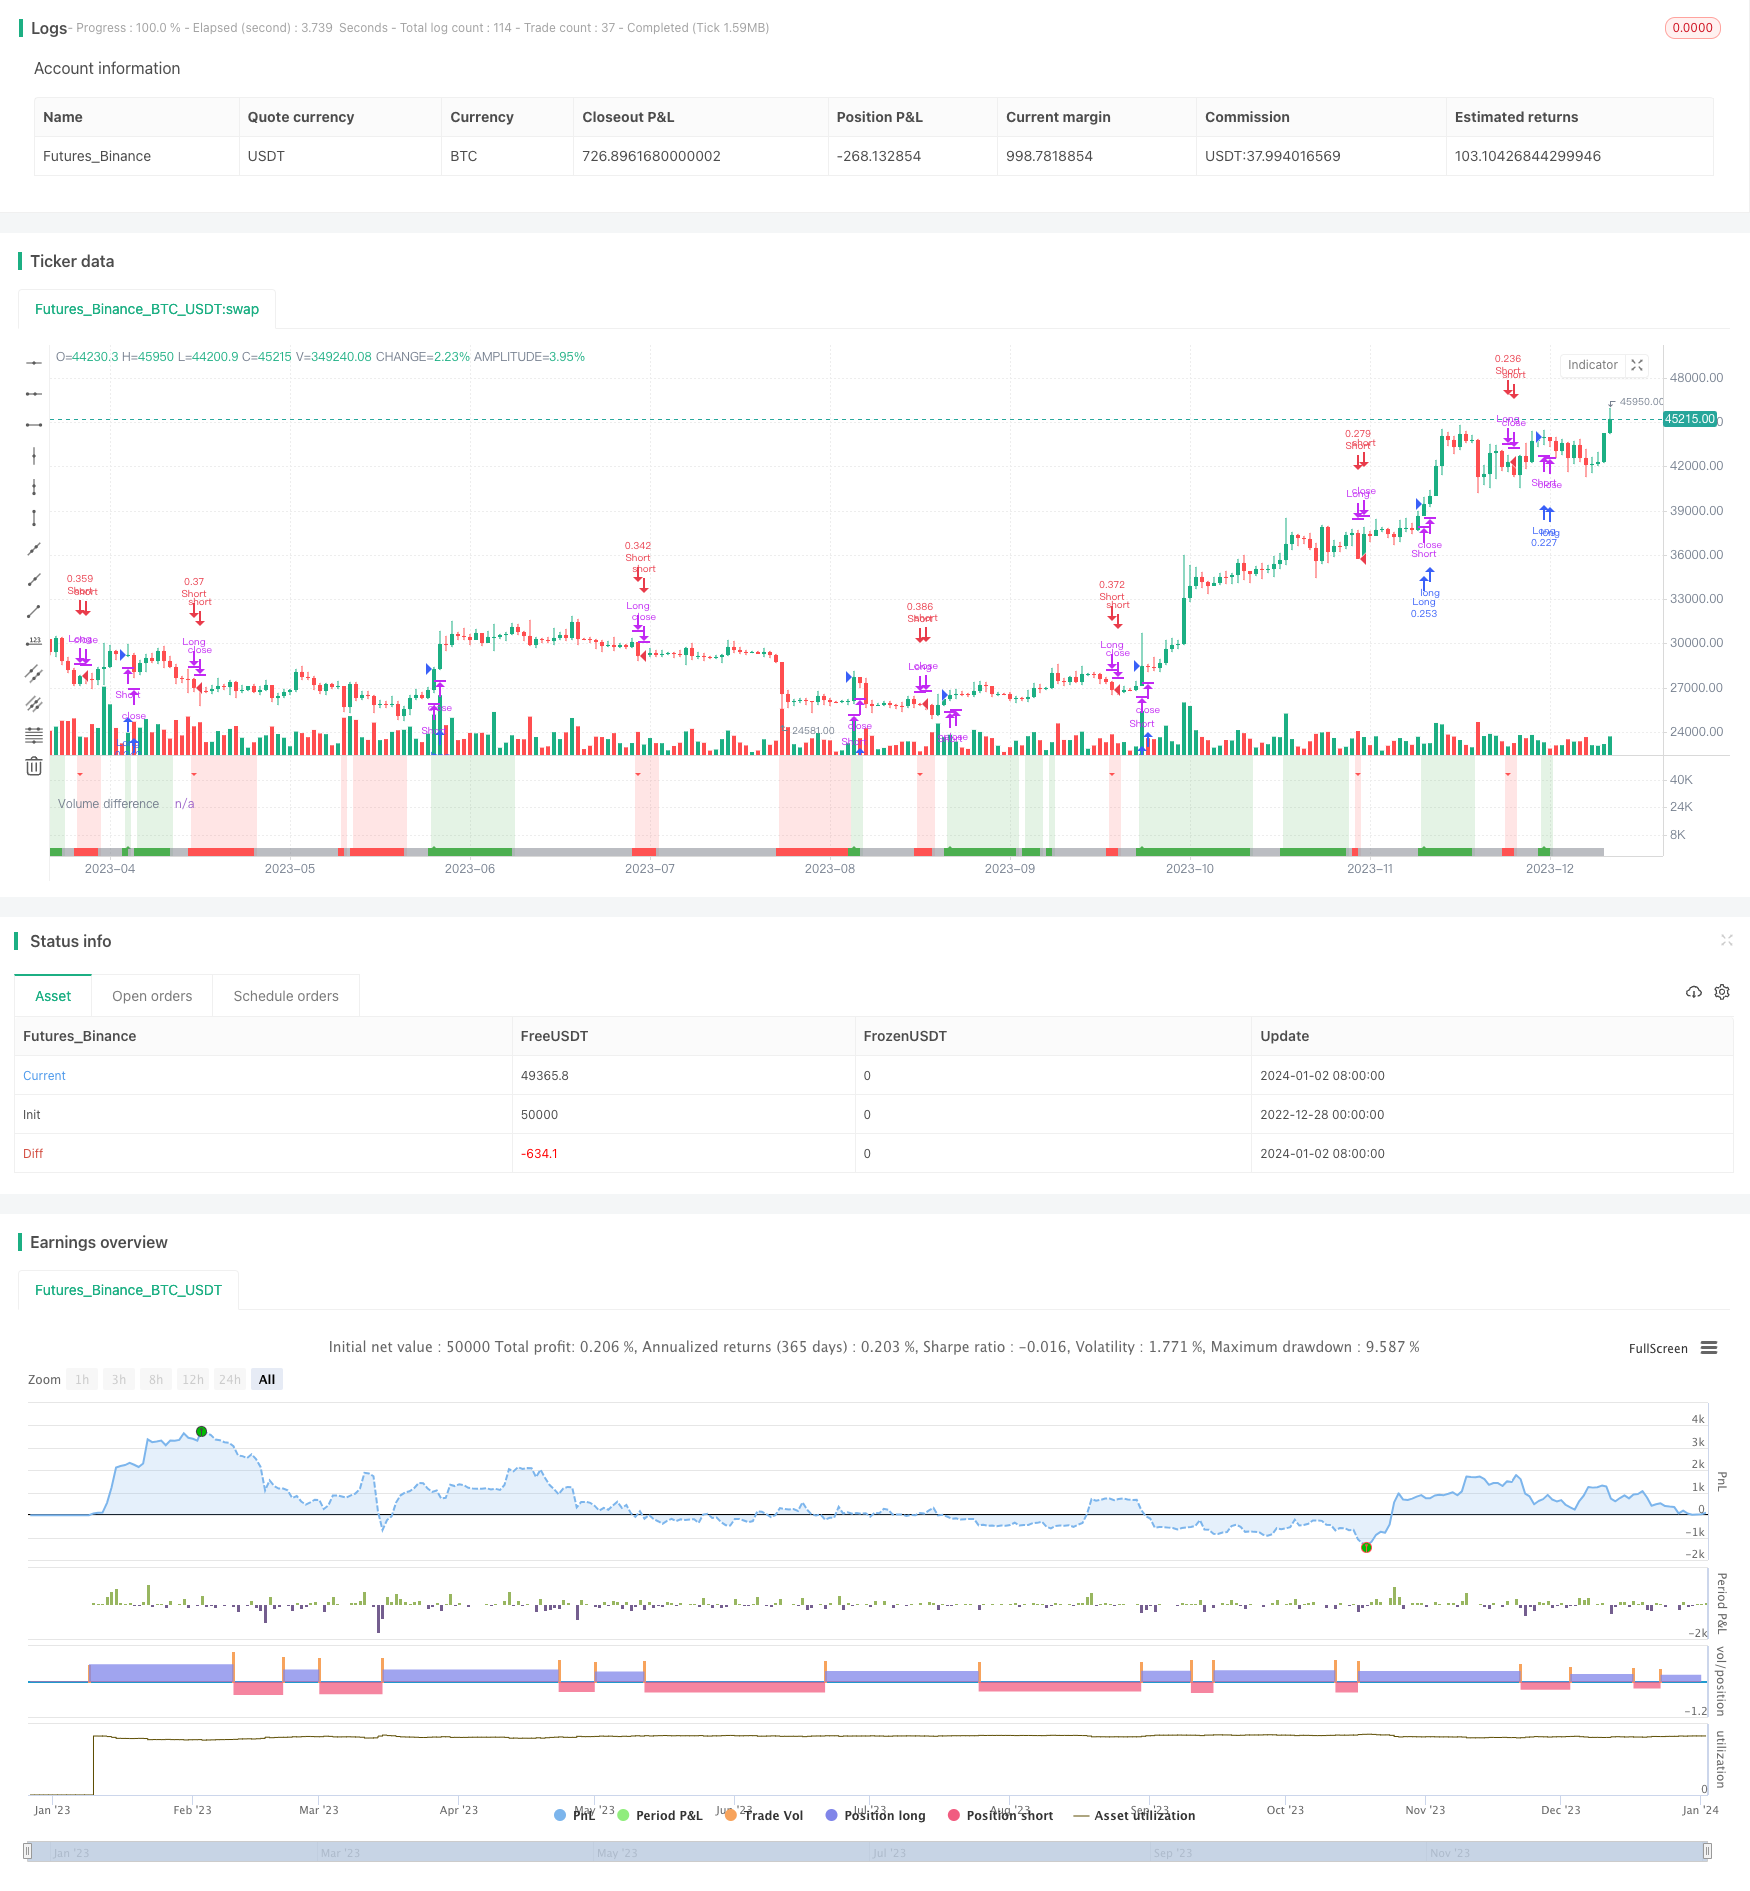
还设置了交易量平均值,用来识别盘整区域。如果多空交易量没有明显差异,会提示目前处于盘整状态。
优势分析
- 使用交易量信息判断市场参与者情绪,信号产生有理论依据
- 自动识别盘整区域,可以避免错过重要信号
- 可自定义参数,适应不同交易品种和时间周期
- 可单独判断多头和空头信号,也可以只跟随单边信号
风险分析
- 交易量数据存在被操纵的可能
- 默认参数可能不适合所有品种,需要优化
- 盘整识别参数设置不当可能错过信号
- 短周期内可能产生错误信号
可以通过参数优化、组合其他指标等方法来减少风险。
优化方向
- 测试不同的计算交易量的方法
- 尝试不同的移动平均类型,如EMA、SMMA等
- 优化计算平均量的周期参数
- 优化识别盘整的交易量差异参数
- 结合其他技术指标过滤信号
总结
量能驱动策略通过智能判断交易量的多空分布情况,自动判断市场情绪和趋势变化,可单独使用,也可与其他策略组合。参数优化和指标组合可以进一步提高策略的稳定性和盈利能力。
策略源码
/*backtest
start: 2022-12-28 00:00:00
end: 2024-01-03 00:00:00
period: 1d
basePeriod: 1h
exchanges: [{"eid":"Futures_Binance","currency":"BTC_USDT"}]
*/

// This source code is subject to the terms of the Mozilla Public License 2.0 at https://mozilla.org/MPL/2.0/
// © Shuttle_Club
//@version=5

strategy('Volume fight strategy', default_qty_type=strategy.cash, default_qty_value=10000, currency='USD', commission_value=0.04, calc_on_order_fills=false, calc_on_every_tick=false, initial_capital=10000)

direction = input.string('ANY', 'Direction', options=['LONG', 'SHORT', 'ANY'], tooltip='Select the direction of trade.\n\nВыберите направление торговли.')
ma = input.int(11, 'Search_range', minval=1, tooltip='The range of estimation of the predominance of bullish or bearish volume (quantity bars). The smaller the TF, the higher the range value should be used to filter out false signals.\n\nДиапазон оценки преобладания бычьего или медвежьего объема (количество баров). Чем меньше ТФ, тем выше следует использовать значение диапазона, чтобы отфильтровать ложные сигналы.')
delta = input.float(15, 'Smoothing_for_flat,%', step=0.5, minval=0, tooltip='Smoothing to reduce false signals and highlight the flat zone. If you set the percentage to zero, the flat zones will not be highlighted, but there will be much more false signals, since the indicator becomes very sensitive when the smoothing percentage decreases.\n\nСглаживание для уменьшения ложных сигналов и выделения зоны флета. Если выставить процент равным нулю, то зоны флета выделяться не будут, но будет гораздо больше ложных сигналов, так как индикатор становится очень чувствительным при снижении процента сглаживания')
bgshow = input.bool(true, 'Show background zones', tooltip='Show the color background of the current trading zone.\n\nПоказывать цветовой фон текущей торговой зоны.')
all_signal_show = input.bool(false, 'Show each setup in zone', tooltip='Show every signals into trading zone.\n\nПоказывать каждый сигнал внутри торговой зоны.')

/////   CALCULATION
bull_vol = open < close ? volume : volume * (high - open) / (high - low)  //determine the share of bullish volume
bear_vol = open > close ? volume : volume * (open - low) / (high - low)  //determine the share of bearish volume
avg_bull_vol = ta.vwma(bull_vol, ma)  //determine vwma
avg_bear_vol = ta.vwma(bear_vol, ma)
diff_vol = ta.sma(avg_bull_vol / volume - 1 - (avg_bear_vol / volume - 1), ma)  //normalize and smooth the values
vol_flat = math.abs(avg_bull_vol + avg_bear_vol) / 2  //determine average value for calculation flat-filter

/////   SIGNALS
up = int(na), up := nz(up[1])
dn = int(na), dn := nz(dn[1])
bull = avg_bull_vol > avg_bear_vol and vol_flat / avg_bull_vol < 1 - delta / 100  //determine up zones
bear = avg_bull_vol < avg_bear_vol and vol_flat / avg_bear_vol < 1 - delta / 100  //determine dn zones

if bull
    up += 1, dn := 0
    dn
if bear
    dn += 1, up := 0
    up
if not bull and not bear and all_signal_show
    up := 0, dn := 0
    dn

/////   PLOTTING
plotshape(bull and up == 1, 'UP', location=location.bottom, style=shape.triangleup, color=color.new(color.green, 0), size=size.tiny)
plotshape(bear and dn == 1, 'DN', location=location.top, style=shape.triangledown, color=color.new(color.red, 0), size=size.tiny)
bgcolor(title='Trading zones', color=bgshow and avg_bull_vol > avg_bear_vol and vol_flat / avg_bull_vol < 1 - delta / 100 ? color.new(color.green, 85) : bgshow and avg_bull_vol < avg_bear_vol and vol_flat / avg_bear_vol < 1 - delta / 100 ? color.new(color.red, 85) : na)
plot(diff_vol, 'Volume difference', style=plot.style_area, color=avg_bull_vol > avg_bear_vol and vol_flat / avg_bull_vol < 1 - delta / 100 ? color.new(color.green, 0) : avg_bull_vol < avg_bear_vol and vol_flat / avg_bear_vol < 1 - delta / 100 ? color.new(color.red, 0) : color.new(color.gray, 50))

strategy.close('Short', comment='close', when=bull and up == 1)
strategy.close('Long', comment='close', when=bear and dn == 1)
strategy.entry('Long', strategy.long, when=direction != 'SHORT' and bull and up == 1)
strategy.entry('Short', strategy.short, when=direction != 'LONG' and bear and dn == 1)

if bull and up==1
    alert('Bullish movement! LONG trading zone', alert.freq_once_per_bar_close)
if bear and dn==1
    alert('Bearish movement! SHORT trading zone', alert.freq_once_per_bar_close)